Answered step by step
Verified Expert Solution
Link Copied!

Question

1 Approved Answer

27. Calculating Descriptive Statistics Check Your Understanding Consider the following returns data for the market and XYZ, Inc. Year 1 Market 10.5% 15.6 -2.0 9.2
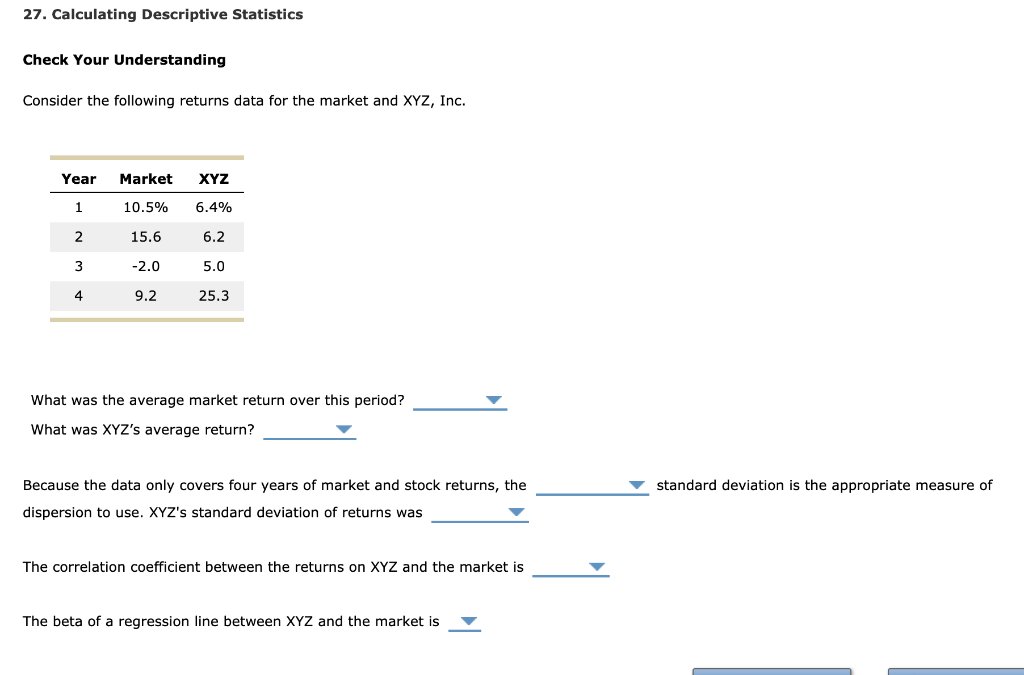
image text in transcribed

27. Calculating Descriptive Statistics Check Your Understanding Consider the following returns data for the market and XYZ, Inc. Year 1 Market 10.5% 15.6 -2.0 9.2 XYZ 6.4% 6.2 5.0 25.3 3 4. What was the average market return over this period? What was XYZ's average return? standard deviation is the appropriate measure of Because the data only covers four years of market and stock returns, the dispersion to use. XYZ's standard deviation of returns was The correlation coefficient between the returns on XYZ and the market is The beta of a regression line between XYZ and the market is

Step by Step Solution

There are 3 Steps involved in it

Step: 1

blur-text-image

Get Instant Access to Expert-Tailored Solutions

See step-by-step solutions with expert insights and AI powered tools for academic success

Step: 2

blur-text-image_2

Step: 3

blur-text-image_3

Ace Your Homework with AI

Get the answers you need in no time with our AI-driven, step-by-step assistance

Get Started

Recommended Textbook for

Raising Venture Capital

Authors: Rupert Pearce, Simon Barnes

1st Edition

0470027576, 978-0470027578

More Books

Students also viewed these Finance questions