Answered step by step
Verified Expert Solution
Question
1 Approved Answer
3. [-/1 Points] DETAILS TANAPCALC9 6.3.013. WY NOTES MY NOTES Find an approximation of the area of the region R under the graph of the
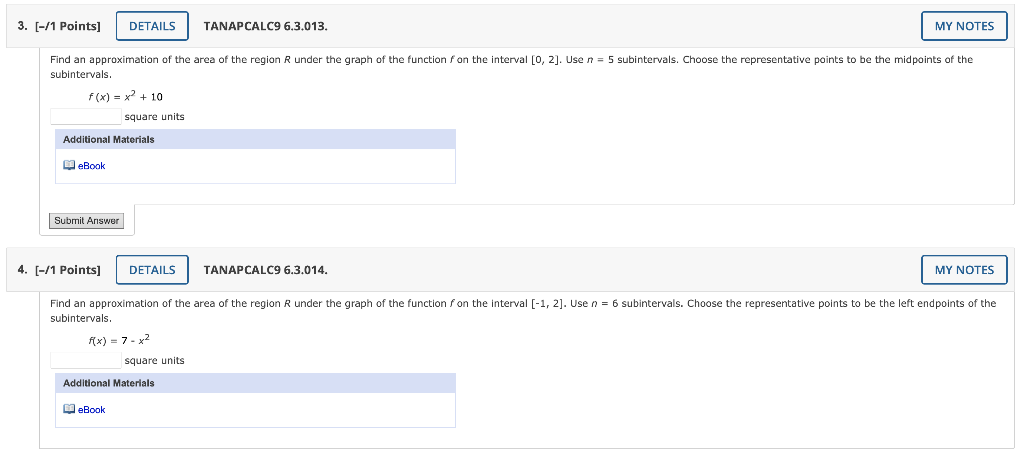
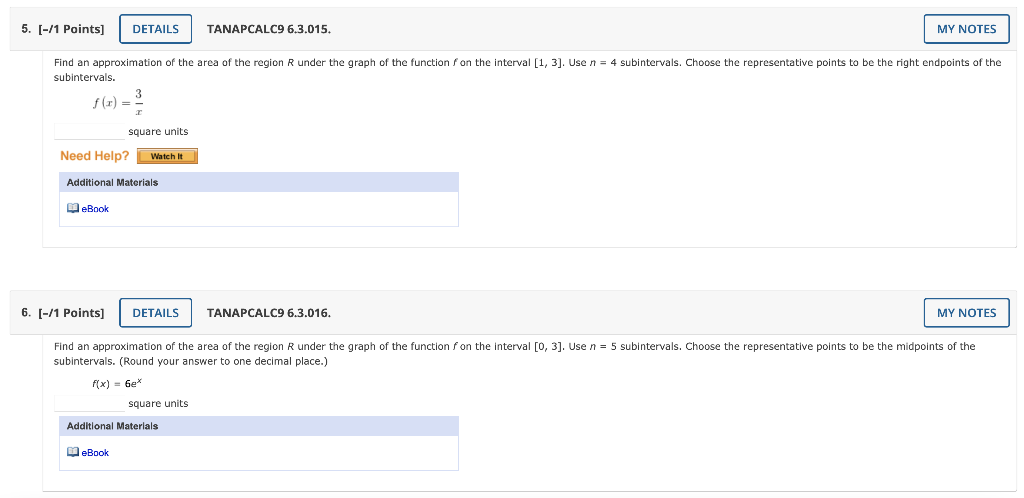
3. [-/1 Points] DETAILS TANAPCALC9 6.3.013. WY NOTES MY NOTES Find an approximation of the area of the region R under the graph of the function f on the interval [0, 2]. Use n = 5 subintervals. Choose the representative points to be the midpoints of the subintervals. f(x) = x2 + 10 square units Additional Materials eBook Submit Answer 4. (-/1 Points] DETAILS TANAPCALC9 6.3.014. MY NOTES Find an approximation of the area of the region R under the graph of the function f on the interval [-1, 2]. Use n = 6 subintervals. Choose the representative points to be the left endpoints of the subintervals. 1x) = 7.32 square units Additional Materials eBook 5. (-/1 Paints] DETAILS TANAPCALC9 6.3.015. MY NOTES Find an approximation of the area of the region R under the graph of the function f on the interval [1, 3]. Use n = 4 subintervals. Choose the representative points to be the right endpoints of the subintervals. square units Need Help? Watch Additional Materials eBook MY NOTES 6. (-/1 Points] DETAILS TANAPCALC9 6.3.016. MY NOTES Find an approximation of the area of the region R under the graph of the function f on the interval [0, 3]. Use n = 5 subintervals. Choose the representative points to be the midpoints of the subintervals. (Round your answer to one decimal place.) f(x) = 6e* square units Additional Materials eBook
Step by Step Solution
There are 3 Steps involved in it
Step: 1
Get Instant Access to Expert-Tailored Solutions
See step-by-step solutions with expert insights and AI powered tools for academic success
Step: 2
Step: 3
Ace Your Homework with AI
Get the answers you need in no time with our AI-driven, step-by-step assistance
Get Started