

Answered step by step
Verified Expert Solution
Question
1 Approved Answer
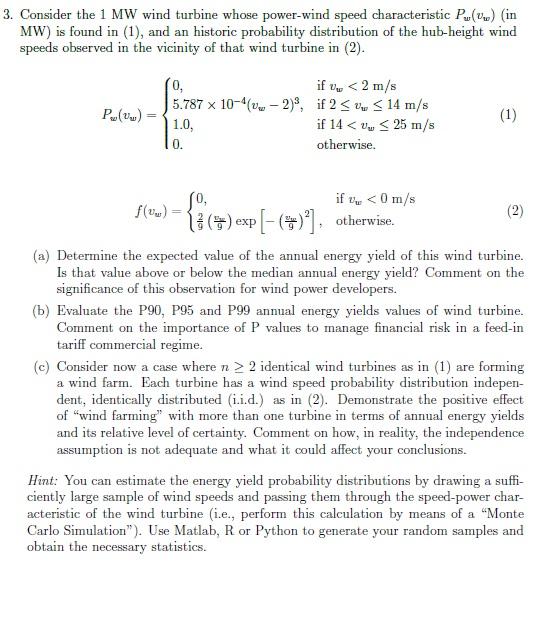
3. Consider the 1 MW wind turbine whose power-wind speed characteristic Pu (vw) (in MW) is found in (1), and an historic probability distribution of
Step by Step Solution
There are 3 Steps involved in it
Step: 1

Get Instant Access to Expert-Tailored Solutions
See step-by-step solutions with expert insights and AI powered tools for academic success
Step: 2

Step: 3
Ace Your Homework with AI
Get the answers you need in no time with our AI-driven, step-by-step assistance
Get Started
Internal Audit And Risk Management In Companies Assessing The Contribution Of Internal Audit To An Entitys Risk Management
Authors: Akaffou Arnaud Lucien Goley
1st Edition
6204604805, 978-6204604800