Answered step by step
Verified Expert Solution
Question
1 Approved Answer
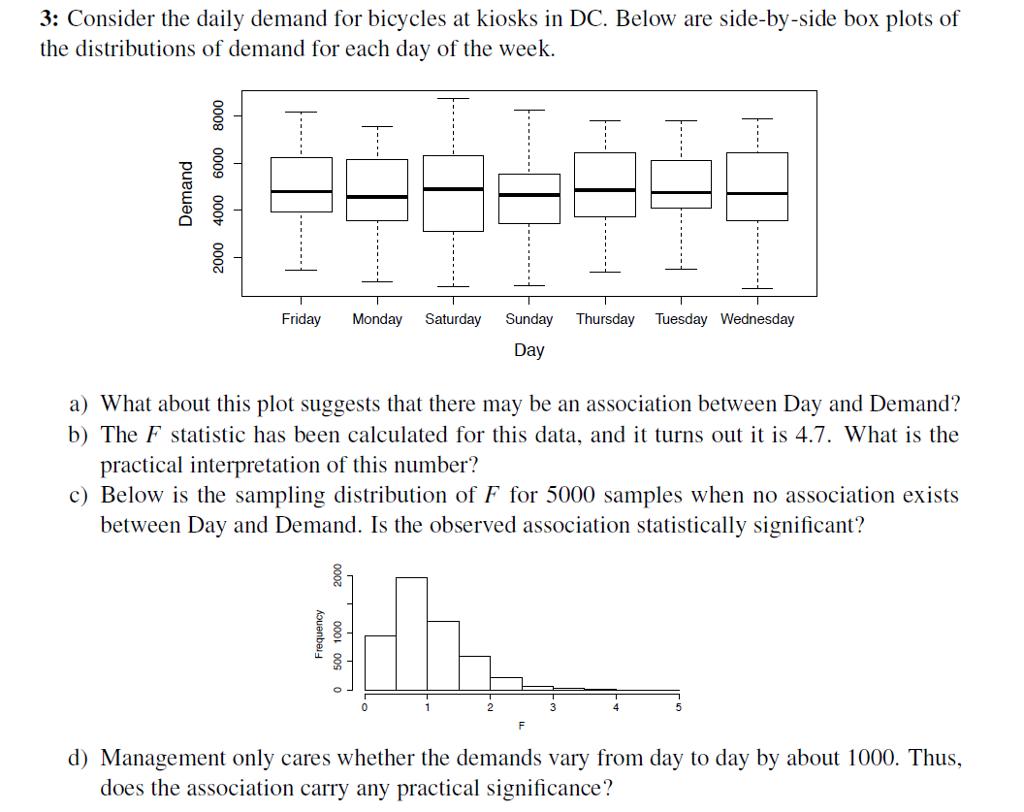
3: Consider the daily demand for bicycles at kiosks in DC. Below are side-by-side box plots of the distributions of demand for each day

3: Consider the daily demand for bicycles at kiosks in DC. Below are side-by-side box plots of the distributions of demand for each day of the week. Friday Monday Saturday Sunday Thursday Tuesday Wednesday Day a) What about this plot suggests that there may be an association between Day and Demand? b) The F statistic has been calculated for this data, and it turns out it is 4.7. What is the practical interpretation of this number? c) Below is the sampling distribution of F for 5000 samples when no association exists between Day and Demand. Is the observed association statistically significant? 2 3 4 d) Management only cares whether the demands vary from day to day by about 1000. Thus, does the association carry any practical significance? Demand 2000 4000 6000 8000 Frequency 0 500 1000 2000
Step by Step Solution
★★★★★
3.31 Rating (154 Votes )
There are 3 Steps involved in it
Step: 1
Answer to part a The plot doesnot suggest any relation in the days and demand of cycle there is no d...
Get Instant Access to Expert-Tailored Solutions
See step-by-step solutions with expert insights and AI powered tools for academic success
Step: 2

Step: 3

Ace Your Homework with AI
Get the answers you need in no time with our AI-driven, step-by-step assistance
Get Started


