

Answered step by step
Verified Expert Solution
Question
1 Approved Answer
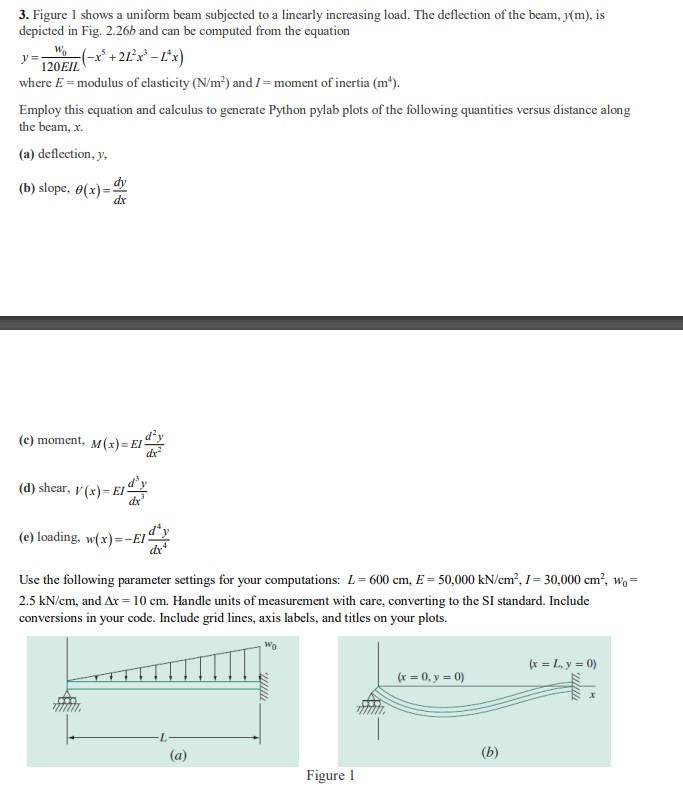
3. Figure 1 shows a uniform beam subjected to a linearly increasing load. The deflection of the beam, y(m), is depicted in Fig. 2.26b and
Step by Step Solution
There are 3 Steps involved in it
Step: 1

Get Instant Access to Expert-Tailored Solutions
See step-by-step solutions with expert insights and AI powered tools for academic success
Step: 2

Step: 3
Ace Your Homework with AI
Get the answers you need in no time with our AI-driven, step-by-step assistance
Get Started
Accounting For Decision Making And Control
Authors: Jerold L. Zimmerman
4th Edition
0072501790, 9780072501797