

Answered step by step
Verified Expert Solution
Question
1 Approved Answer
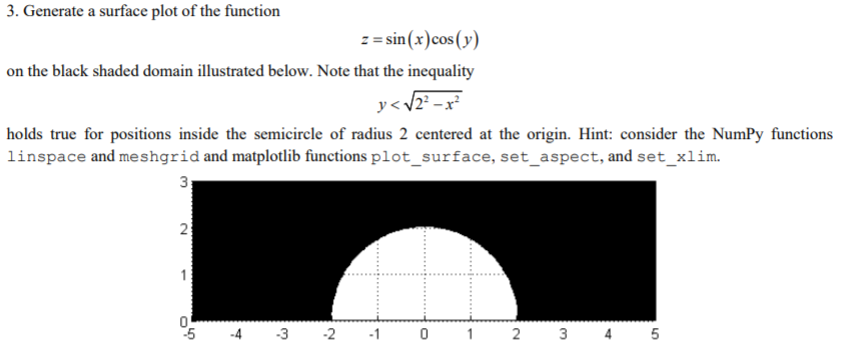
3. Generate a surface plot of the function sin(x)cos( on the black shaded domain illustrated below. Note that the inequality holds true for positions inside
Step by Step Solution
There are 3 Steps involved in it
Step: 1

Get Instant Access to Expert-Tailored Solutions
See step-by-step solutions with expert insights and AI powered tools for academic success
Step: 2

Step: 3
Ace Your Homework with AI
Get the answers you need in no time with our AI-driven, step-by-step assistance
Get Started
Database Design And Implementation
Authors: Edward Sciore
2nd Edition
3030338355, 978-3030338350