

Answered step by step
Verified Expert Solution
Question
1 Approved Answer
3. Implied Volatility: Recently, the S&P 500 (GSPC) was trading at 2604.47. At that time the GSPC had a dividend yield of 1.88%. The
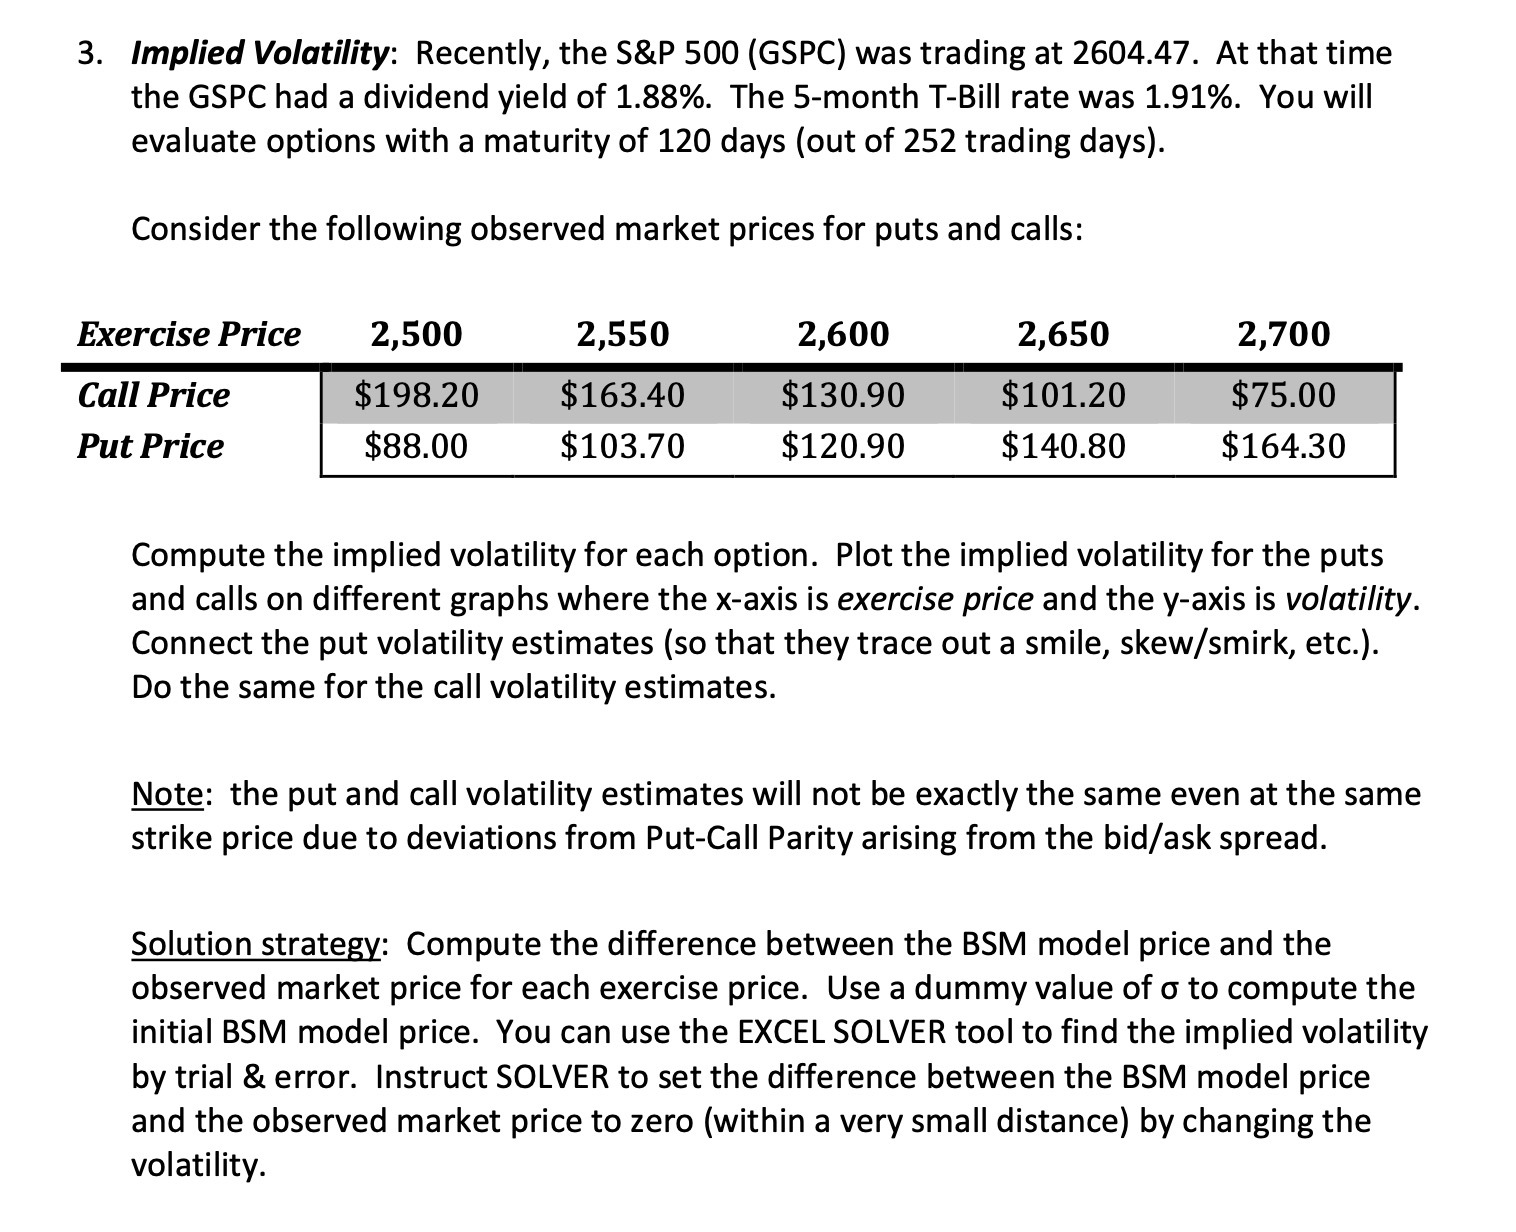
3. Implied Volatility: Recently, the S&P 500 (GSPC) was trading at 2604.47. At that time the GSPC had a dividend yield of 1.88%. The 5-month T-Bill rate was 1.91%. You will evaluate options with a maturity of 120 days (out of 252 trading days). Consider the following observed market prices for puts and calls: Exercise Price 2,500 2,550 2,600 2,650 2,700 Call Price Put Price $198.20 $163.40 $130.90 $101.20 $75.00 $88.00 $103.70 $120.90 $140.80 $164.30 Compute the implied volatility for each option. Plot the implied volatility for the puts and calls on different graphs where the x-axis is exercise price and the y-axis is volatility. Connect the put volatility estimates (so that they trace out a smile, skew/smirk, etc.). Do the same for the call volatility estimates. Note: the put and call volatility estimates will not be exactly the same even at the same strike price due to deviations from Put-Call Parity arising from the bid/ask spread. Solution strategy: Compute the difference between the BSM model price and the observed market price for each exercise price. Use a dummy value of to compute the initial BSM model price. You can use the EXCEL SOLVER tool to find the implied volatility by trial & error. Instruct SOLVER to set the difference between the BSM model price and the observed market price to zero (within a very small distance) by changing the volatility.
Step by Step Solution
There are 3 Steps involved in it
Step: 1
Answer To compute the implied volatility for each option we can use the BlackScholesMerton BSM model ...
Get Instant Access to Expert-Tailored Solutions
See step-by-step solutions with expert insights and AI powered tools for academic success
Step: 2

Step: 3
Ace Your Homework with AI
Get the answers you need in no time with our AI-driven, step-by-step assistance
Get Started
Derivatives Principles And Practice
Authors: Rangarajan Sundaram
2nd Edition
0078034736, 9780078034732