

Answered step by step
Verified Expert Solution
Question
1 Approved Answer
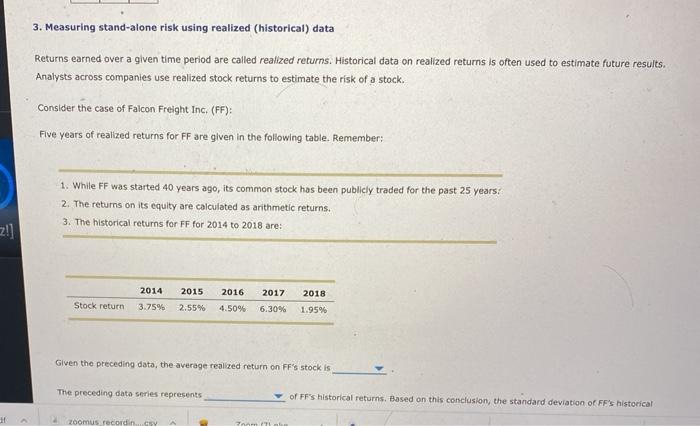
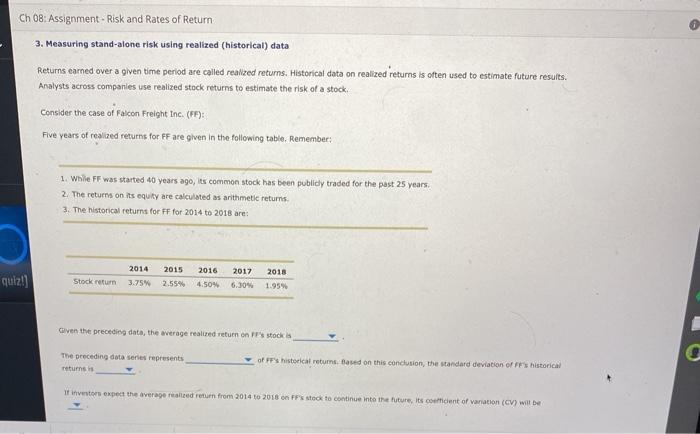
3. Measuring stand-alone risk using realized (historical) data Returns earned over a given time period are called realized returns. Historical data on realized returns is
Step by Step Solution
There are 3 Steps involved in it
Step: 1

Get Instant Access to Expert-Tailored Solutions
See step-by-step solutions with expert insights and AI powered tools for academic success
Step: 2

Step: 3
Ace Your Homework with AI
Get the answers you need in no time with our AI-driven, step-by-step assistance
Get Started
Master Your Trades Playbook Think In Probabilities By Mechanically Executing 30 Trades
Authors: Lee Beckett
1st Edition
B0CDNKS86Q