

Question: 3 Merge & Center B1 fx B C D E G H 4 5 Start with the partial model in the file Ch12 P10 Build
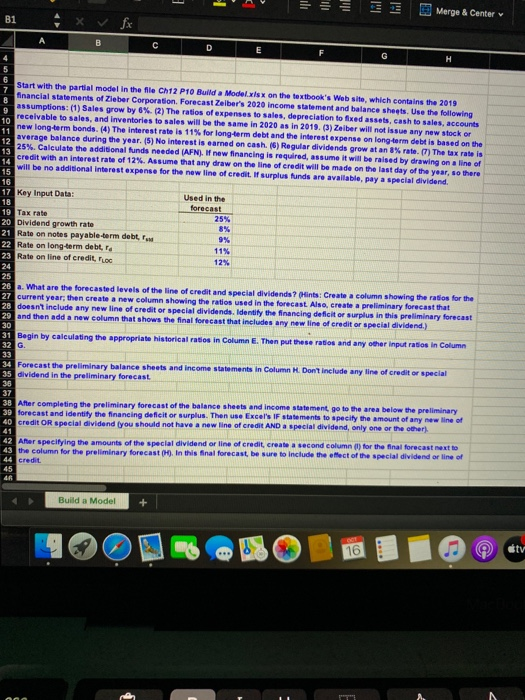
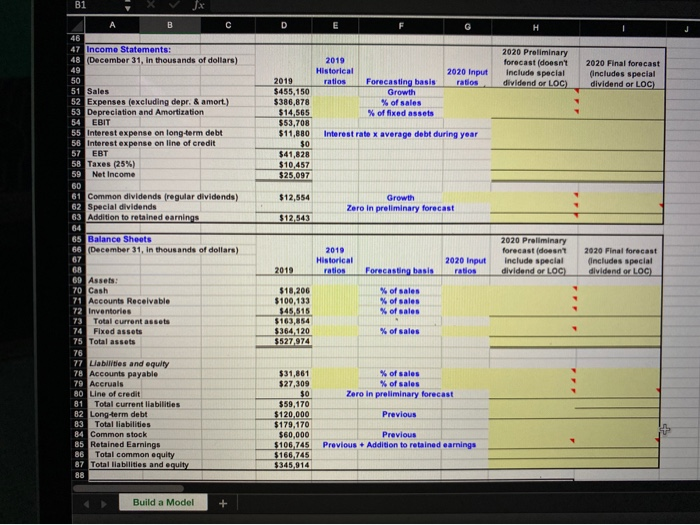
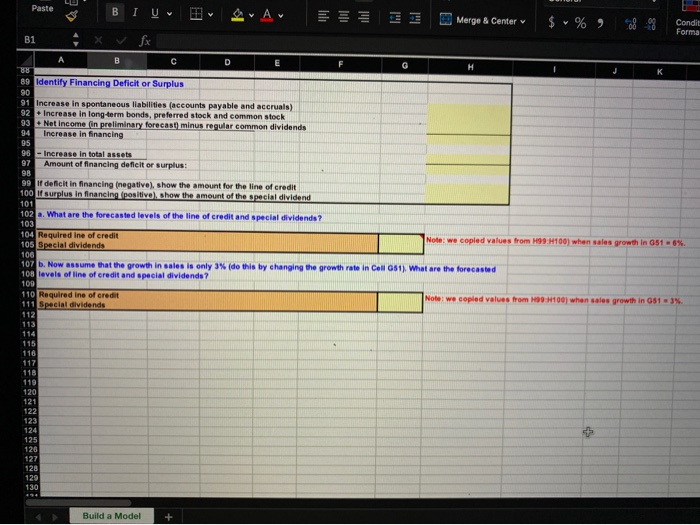
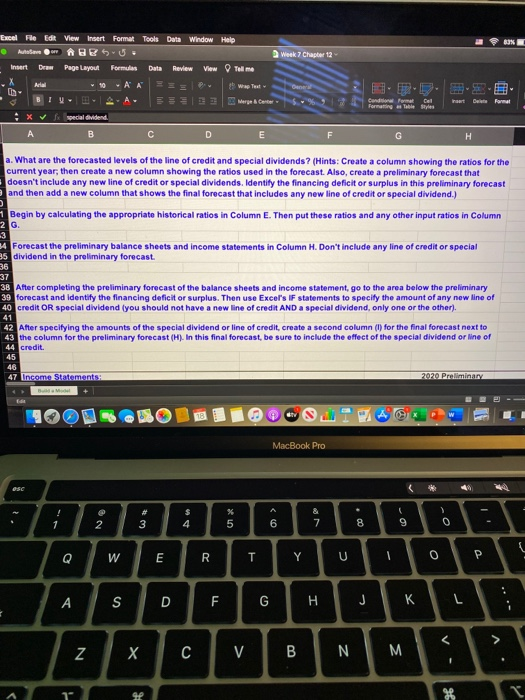
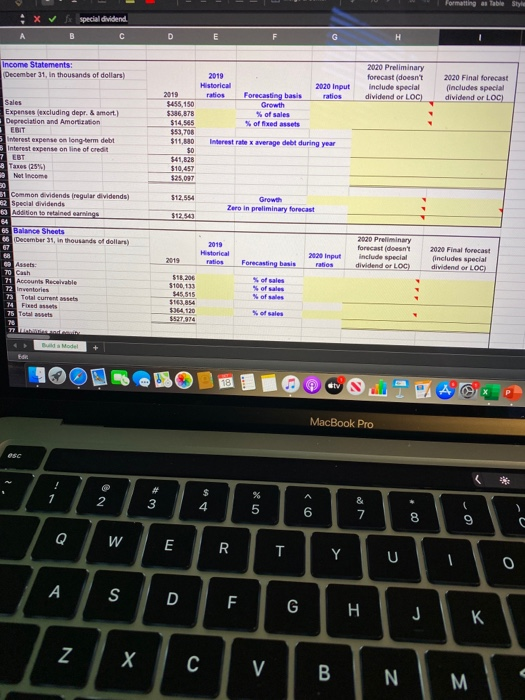
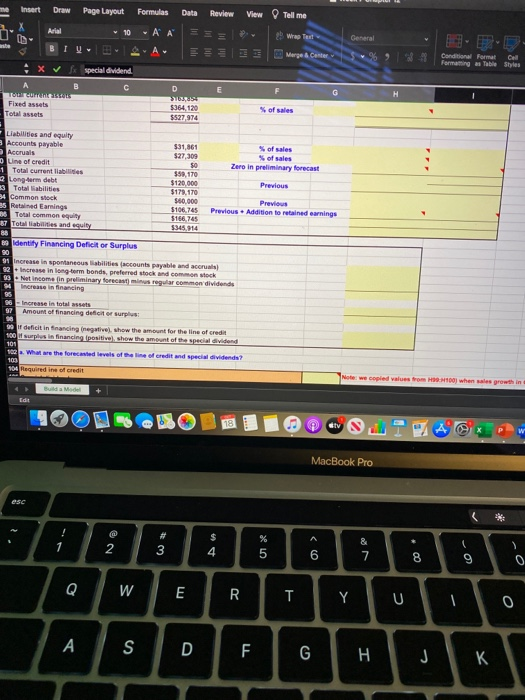

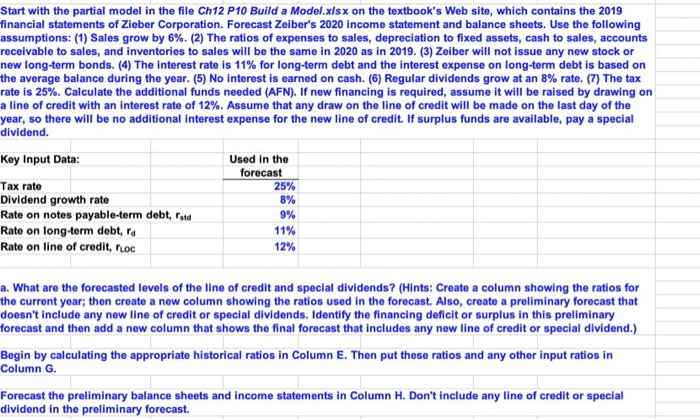
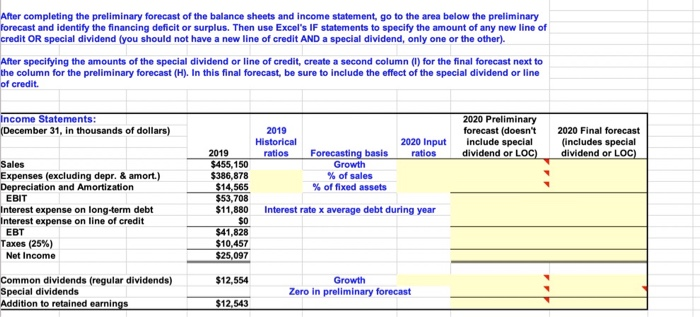
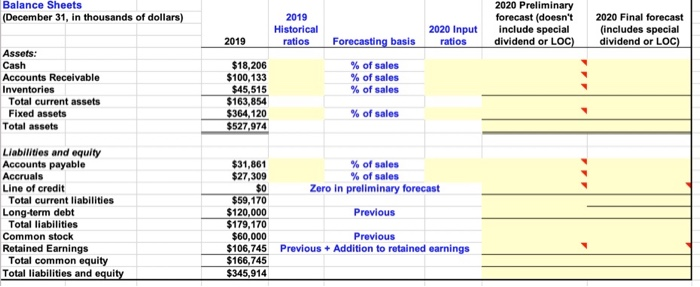
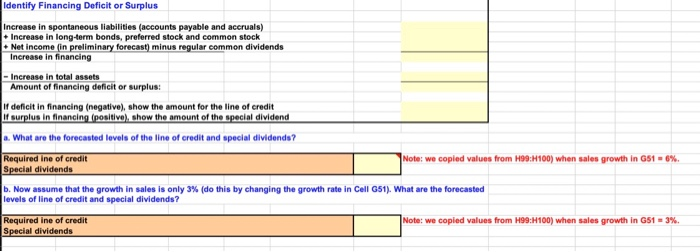
3 Merge & Center B1 fx B C D E G H 4 5 Start with the partial model in the file Ch12 P10 Build a Model.xlsx on the textbook's Web site, which contains the 2019 financial statements of Zieber Corporation. Forecast Zeiber's 2020 Income statement and balance sheets. Use the following assumptions: (1) Sales grow by 6% (2) The ratio of expenses to sales, depreciation to fixed assets, cash to sales, accounts 9 receivable to sales, and inventories to sales will be the same in 2020 as in 2019.) Zelber will not issue any new stock or 10 11 new long-term bonds. (4) The Interest rate is 11% for long term debt and the interest expense on long-term debt is based on the 12 average balance during the year. (5) No interest is earned on cash. (6) Regular dividends grow at an 8% rate.) The tax rate is 25%. Calculate the additional funds needed (AFN). If new financing is required, assume it will be raised by drawing on a line of 13 14 credit with an interest rate of 12%. Assume that any draw on the line of credit will be made on the last day of the year, so there will be no additional interest expense for the new line of credit. If surplus funds are available, pay a special dividend. 15 16 17 Key Input Data: Used in the 18 forecast 19 Tax rate 25% 20 Dividend growth rate 8% 21 Rate on notes payable-term debt. 9% 22 Rate on long-term debt.ro 11% 23 Rate on line of credit. Fuoc 12% 24 25 26 . What are the forecasted levels of the line of credit and special dividends? Hints: Create a column showing the ratios for the 27 current year, then create a new column showing the ratios used in the forecast Also, create a preliminary forecast that 28 doesn't include any new line of credit or special dividends. Identity the financing deficit or surplus in this preliminary forecast 29 and then add a new column that shows the final forecast that includes any new line of credit or special dividend.) 30 31 Begin by calculating the appropriate historical ratios in Column E. Then put these ratios and any other input ratios in Column 32 G 33 34 Forecast the preliminary balance sheets and income statements in Column H. Don't include any line of credit or special 35 dividend in the preliminary forecast 36 37 38 After completing the preliminary forecast of the balance sheets and income statement go to the area below the preliminary 39 forecast and identity the financing deficit or surplus. Then use Excel's IF statements to specify the amount of any new line of 40 credit OR special dividend you should not have a new line of credit AND a special dividend, only one or the other). 42 Aer specifying the amounts of the special dividend or line of credit, create a second column (1) for the final forecast next to 43 the column for the preliminary forecast (H). In this final forecast, be sure to include the effect of the special dividend or line of 44 credit 45 Build a Model 16 ctv B1 D E H 2019 Historical ratios 2020 Input ratios 2020 Preliminary forecast doesn't Include special dividend or LOC) 2020 Final forecast (Includes special dividend or LOC) Forecasting basis Growth % of sales % of fixed assets 2019 $455,150 $386,878 $14,565 $53,708 $11,880 50 $41,828 $10,457 $25,097 Interest rate x average debt during year $12,554 Growth Zero in preliminary forecast $12.543 B 46 47 Income Statements: 48 (December 31, in thousands of dollars) 49 50 51 Sales 52 Expenses (excluding depr. & amort) 53 Depreciation and Amortization 54 EBIT 55 Interest expense on long-term debt 56 Interest expense on line of credit 57 EBT 58 Taxes (25%) 59 Net Income 60 61 Common dividends (regular dividends) 62 Special dividends 63 Addition to retained earnings 64 65 Balance Sheets 66 (December 31, in thousands of dollars) 67 68 69 Assets 70 Cash 71 Accounts Receivable 72 Inventories 73 Total current assets 74 Fixed assets 75 Total assets 76 77 Liabilities and equity 78 Accounts payable 79 Accruals 80 Line of credit 81 Total current liabilities 82 Long-term debt Total liabilities 84 Common stock 85 Retained Earnings 86 Total common equity 87 Total liabilities and equity 88 2019 Historical ratios 2020 Preliminary forecast doesn't Include special dividend or LOC 2020 Final forecast Includes special dividend or LOC) 2020 Input ratios 2010 Forecasting basis % of sales % of sales % of sales $10,206 $100,133 $45 515 $163,854 $364, 120 5527,974 % of sales % of sales % of sales Zoro in preliminary forecast $31,861 $27,309 $0 $59,170 $120,000 $179,170 $60,000 $106.745 $166,745 $345,914 Previous Previous Previous + Addition to retained earnings Build a Model Paste B IV Merge & Center $ %) Condit Forma B1 B D E G H K 89 Identify Financing Deficit or Surplus 90 91 Increase in spontaneous liabilities (accounts payable and accruals) 92 - Increase in long-term bonds, preferred stock and common stock 93 - Net Income (in preliminary forecast) minus regular common dividends 94 Increase in financing 95 96 - Increase in total assets 97 Amount of financing deficit or surplus: 98 99 i deficit in financing (negative), show the amount for the line of credit 100 of surplus in financing positive), show the amount of the special dividend 101 102 a. What are the forecasted levels of the line of credit and special dividends? 103 104 Required ine of credit Note: we copied values from 199H100) when sales growth in 651 - 6% 105 Special dividends 106 107 b. Now assume that the growth in sales is only 3% (do this by changing the growth rate in Cell G51) What are the forecasted 108 levels of line of credit and special dividends? 100 110 Required ine of credit Note: We copled values from 99 H100) when sales growth in 051-3% 111 Special dividends 112 113 114 115 116 117 118 119 120 121 122 123 124 125 126 127 128 129 130 Build a Model E Merge & Center v B1 G A B C E F H 2 Chapter: 12 3 Problem: 10 4 5 6 Start with the partial model in the file Ch12 P10 Build a Model.xlsx on the textbook's Web site, which contains the 2019 7 financial statements of Zieber Corporation. Forecast Zeiber's 2020 Income statement and balance sheets. Use the following 8 assumptions: (1) Sales grow by 6%. (2) The ratios of expenses to sales, depreciation to fixed assets, cash to sales, accounts receivable to sales, and inventories to sales will be the same in 2020 as in 2019. (3) Zeiber will not issue any new stock or 10 new long-term bonds. (4) The interest rate is 11% for long-term debt and the interest expense on long-term debt is based on the 11 average balance during the year. (5) No interest is earned on cash. (6) Regular dividends grow at an 8% rate. (7) The tax rate is 25%. Calculate the additional funds needed (AFN). If new financing is required, assume it will be raised by drawing on a line of credit with an interest rate of 12%. Assume that any draw on the line of credit will be made on the last day of the year, so there will be no additional Interest expense for the new line of credit. If surplus funds are available, pay a special dividend. 6 7 Key Input Data: Used in the 8 forecast 9 Tax rate 25% Co Dividend growth rate 8% 1 Rate on notes payable-term debt, und 9% 2 Rate on long-term debt, 11% 3 Rate on line of credit, Floc 12% 4 5 6 a. What are the forecasted levels of the line of credit and special dividends ? (Hints: Create a column showing the ratios for the 7 current year, then create a new column showing the ratios used in the forecast. Also, create a preliminary forecast that 8 doesn't include any new line of credit or special dividends. Identify the financing deficit or surplus in this preliminary forecast 9 and then add a new column that shows the final forecast that includes any new line of credit or special dividend.) 0 #1 Begin by calculating the appropriate historical ratios in Column E. Then put these ratios and any other input ratios in Column 2 G. 3 B1 B E A D E F H 16 17 Key Input Data: Used in the 18 forecast 19 Tax rate 25% 20 Dividend growth rate 8% 21 Rate on notes payable-term debt, Ford 9% 22 Rate on long-term debt, ra 11% 23 Rate on line of credit, roc 12% 24 25 26 a. What are the forecasted levels of the line of credit and special dividends ? (Hints: Create a column showing the ratios for the 27 current year, then create a new column showing the ratios used in the forecast. Also, create a preliminary forecast that 28 doesn't include any new line of credit or special dividends. Identify the financing deficit or surplus in this preliminary forecast 29 and then add a new column that shows the final forecast that includes any new line of credit or special dividend.) 10 1 Begin by calculating the appropriate historical ratios in Column E. Then put these ratios and any other input ratios in Column 12 G. 13 4 Forecast the preliminary balance sheets and income statements in Column H. Don't include any line of credit or special 15 dividend in the preliminary forecast. 16 7 18 After completing the preliminary forecast of the balance sheets and income statement, go to the area below the preliminary 9 forecast and identify the financing deficit or surplus. Then use Excel's IF statements to specify the amount of any new line of O credit OR special dividend (you should not have a new line of credit AND a special dividend, only one or the other). 1 2 After specifying the amounts of the special dividend or line of credit, create a second column (1) for the final forecast next to 3 the column for the preliminary forecast (H). In this final forecast, be sure to include the effect of the special dividend or line of 14 credit. 15 16 7 Incama Satamant 2020 Preliminary 31 D E 2020 Preliminary forecast (doesn't Include special dividend or LOC 2020 Final forecast (includes special dividend or LOC) 2019 Historical 2020 Input 2019 ratios Forecasting basis ratios $455,150 Growth $386,878 % of sales $14,565 % of fixed assets $53,708 $11,880 Interest rate x average debt during year $0 $41,828 $10,457 $25,097 $12,554 Growth Zero in preliminary forecast $12,543 B 45 46 47 Income Statements: 48 (December 31, in thousands of dollars) 49 50 51 Sales 52 Expenses (excluding depr. & amort) 53 Depreciation and Amortization 54 EBIT 55 Interest expense on long-term debt 56 Interest expense on line of credit 57 EBT 58 Taxes (25%) 59 Net Income 60 61 Common dividends (regular dividends) 62 Special dividends 63 Addition to retained earnings 64 65 Balance Sheets 66 (December 31, in thousands of dollars) 67 68 69 Assets: 70 Cash 71 Accounts Receivable 72 Inventories 73 Total current assets 74 Fixed assets 75 Total assets 76 77 Liabilities and equity 78 Accounts payable 79 Accruals 80 Line of credit 81 Total current liabilities 82 Long-term debt 83 Total liabilities 84 Common stock 85 Retained Earnings 86 Total common equity 87 Total liabilities and equity 2019 Historical ratios 2020 Preliminary forecast doesn't Include special dividend or LOC) 2020 Final forecast (includes special dividend or LOC) 2020 Input ratios 2010 Forecasting basis % of sales % of sales % of sales $18,206 $100,133 $45,515 $163,854 $364,120 $527,974 % of sales % of sales % of sales Zero in preliminary forecast $31,861 $27,309 $0 $59,170 $120,000 $179,170 $60,000 $106.745 5166, 745 $345,914 Previous Previous Previous + Addition to retained earnings AutoSave OFF BESU. Week 7 Chapter 12 Home Insert Draw Page Layout Formulas Data Review View Tell me Arial 10 A A 2. Wrap Text General Paste BIU EE Merge & Center $ %, 8:09 Conc Form B1 XV fx D E F G 86 Total common equity $166,745 87 Total liabilities and equity $345,914 BB 89 Identify Financing Deficit or Surplus 190 91 Increase in spontaneous liabilities (accounts payable and accruals) 92 + Increase in long-term bonds, preferred stock and common stock 93 Net income (in preliminary forecast) minus regular common dividends Increase in financing 195 196 - Increase in total assets 97 Amount of financing deficit or surplus: 98 99 I deficit in financing (negative), show the amount for the line of credit 100 of surplus in financing foositive), show the amount of the special dividend 101 102 a. What are the forecasted levels of the line of credit and special dividends? 103 104 Required ine of credit Note: we copied values from H99:H100) when sales growth in G51 - 6% 105 Special dividends 106 107 b. Now assume that the growth in sales is only 3% (do this by changing the growth rate in Cell G51). What are the forecasted 10B levels of line of credit and special dividends? 109 110 Required ine of credit Note: we copied values from H99:H100) when sales growth in 651 - 3% 111 Special dividends 112 113 114 115 116 117 118 119 120 9 B D E F H Start with the partial model in the file Ch12 P10 Build a Model.xlsx on the textbook's Web site, which contains the 2019 financial statements of Zieber Corporation. Forecast Zeiber's 2020 income statement and balance sheets. Use the following 8 assumptions: (1) Sales grow by 6%. (2) The ratios of expenses to salos, depreciation receivable to sales, and Inventories to sales will be the same in 2020 as in 2019. (3) Zeiber will not issue any new stock or fixed assets, cash to sales, accounts 10 11 new long-term bonds. (4) The Interest rate is 11% for long-term debt and the interest expense on long-term debt is based on the 12 average balance during 6 year. (5) No interest is earned on cash. (6) Regular dividends grow at an 8% rate (7) The tax rate is 25%. Calculate the additional funds needed (AFN). If new financing is required, assume it will be raised by drawing on a line of 13 14 credit with an interest rate of 12%. Assume that any draw on the line of credit will be made on the last day of the year, so there 15 will be no additional interest expense for the new line of credit. If surplus funds are available, pay a special dividend. 16 17 Key Input Data: Used in the 18 forecast 19 Tax rate 25% 20 Dividend growth rate 8% 21 Rate on notes payable-term debt, 9% 22 Rate on long-term debt, a 11% 23 Rate on line of credit, Poc 12% 24 25 26 a. What are the forecasted levels of the line of credit and special dividends ? (Hints: Create a column showing the ratios for the 27 current year; then create a new column showing the ratios used in the forecast. Also, create a preliminary forecast that 28 doesn't include any new line of credit or special dividends. Identify the financing deficit or surplus in this preliminary forecast 29 and then add a new column that shows the final forecast that includes any new line of credit or special dividend.) 30 31 Begin by calculating the appropriate historical ratios in Column E. Then put these ratios and any other input ratios in Column 32 G. 33 34 Forecast the preliminary balance sheets and income statements in Column H. Don't include any line of credit or special 35 dividend in the preliminary forecast 36 37 38 After completing the preliminary forecast of the balance sheets and income statement, go to the area below the preliminary 39 forecast and identify the financing deficit or surplus. Then use Excel's IF statements to specify the amount of any new line of 40 credit OR special dividend you should not have a new line of credit AND a special dividend, only one or the other). 41 42 After specifying the amounts of the special dividend or line of credit, create a second column (l) for the final forecast next to 43 the column for the preliminary forecast (H). In this final forecast, be sure to include the effect of the special dividend or line of 44 credit B D E H 2019 Historical ratios 2020 Input 2020 Preliminary forecast (doesn't Include special dividend or LOC) 2020 Final forecast (includes special dividend or LOC ratios Forecasting basis Growth % of sales % of fixed assets 2019 $455,150 $386,878 $14,565 $53,708 $11,880 SO $41,828 $10,457 $25,097 Interest rate x average debt during year $12,554 Growth Zero in preliminary forecast $12,543 46 47 Income Statements: 48 (December 31, in thousands of dollars) 49 50 51 Sales 52 Expenses (excluding depr. & amort.) 53 Depreciation and Amortization 54 EBIT 55 Interest expense on long-term debt 56 Interest expense on line of credit 57 EBT 58 Taxes (25%) 59 Net Income 60 61 Common dividends (regular dividends) 62 Special dividends 63 Addition to retained earnings 64 65 Balance Sheets 66 (December 31, in thousands of dollars) 67 68 69 Assets: 70 Cash 71 Accounts Receivable 72 Inventories 73 Total current assets 74 Fixed assets 75 Total assets 76 77 Liabilities and equity 78 Accounts payable 79 Accruals 80 Line of credit 81 Total current liabilities B2 Long-term debt 83 Total liabilities 84 Common stock 85 Retained Earnings 86 Total common equity 87 Total liabilities and equity AR 2019 Historical ratios 2020 Preliminary forecast (doesn't include special dividend or LOC 2020 Final forecast includes special dividend or LOC) 2020 Input ratios 2019 Forecasting basis % of sales % of sales % of sales $18,206 $100,133 $45,515 $163,854 $364,120 $527,974 % of sales % of sales % of sales Zero in preliminary forecast Previous $31,861 $27,309 $0 $59,170 $120,000 $179,170 $60,000 $106,745 $166 745 $345,914 Previous Previous + Addition to retained earnings Home HUU Upel 12 Insert Draw Page Layout Formulas Data Review View Tell me Arial 10 A A 2 Wrap Text General Paste BIU E Merge & Center Conditional Formatting B1 x v fx D G H 89 Identify Financing Deficit or Surplus 90 91 Increase in spontaneous liabilities (accounts payable and accruals) 92 - Increase in long-term bonds, preferred stock and common stock 93 - Net Income in preliminary forecast) minus regular common dividends 94 Increase in financing + 95 96 - Increase in total assets 97 Amount of financing deficit or surplus: 98 99 If deficit in financing (negative), show the amount for the line of credit 100 of surplus in financing positive), show the amount of the special dividend 101 102 a. What are the forecasted levels of the line of credit and special dividends? 103 104 Required ine of credit Note: We copled values from H99-1100) when sales growth in G518% 105 Special dividends 106 107 b. Now assume that the growth in sales is only 3% (do this by changing the growth rate in Cell G51). What are the forecasted 108 levels of line of credit and special dividends? 109 110 Required ine of credit Note: we copied values from H99-H100) when sales growth in 051-3% 111 Special dividends 112 113 114 115 116 117 118 119 120 121 122 123 124 125 126 127 128 25 26 a. What are the forecasted levels of the line of credit and special dividends ? (Hints: Create a column showing the ratios for the 27 current year, then create a new column showing the ratios used in the forecast. Also, create a preliminary forecast that doesn't 28 include any new line of credit or special dividends. Identify the financing deficit or surplus in this preliminary forecast and then 29 add a new column that shows the final forecast that includes any new line of credit or special dividend.) 30 30 31 32 Begin by calculating the appropriate historical ratios in Column E. Then put these ratios and any other input ratios in Column G. 33 34 Forecast the preliminary balance sheets and income statements in Column H. Don't include any line of credit or special dividend 35 in the preliminary forecast. 36 37 38 After completing the preliminary forecast of the balance sheets and income statement, go to the area below the preliminary 39 forecast and identify the financing deficit or surplus. Then use Excel's IF statements to specify the amount of any new line of 40 credit OR special dividend (you should not have a new line of credit AND a special dividend, only one or the other). 41 42 After specifying the amounts of the special dividend or line of credit, create a second column (1) for the final forecast next to the 43 column for the preliminary forecast (H). In this final forecast, be sure to include the effect of the special dividend or line of 44 credit. 45 102. What are the forecasted levels of the line of credit and special dividends? 103 104 Required ine of credit Note: we copied values from H99:H100) when sales growth in G51 = 6% 105 Special dividends 106 107 6. Now assume that the growth in sales is only 3% (do this by changing the growth rate in Cell 651). What are the forecasted 100 levels of line of credit and special dividends? 109 110 Required ine of credit Note: we copled values from H99:H100) when sales growth in 051 - 3% 111 Special dividends 112 113 114 115 BON Excel File Edit View Insert Formal Tools Data Window Help e Auta BU. Week 7 Chapter 12 Intent Dram Page Layout Formulas Data View Tell me Arla - A A Insert Cell Forming Table Styles Format X special dividend. B D E F G H a. What are the forecasted levels of the line of credit and special dividends? (Hints: Create a column showing the ratios for the current year, then create a new column showing the ratios used in the forecast. Also, create a preliminary forecast that doesn't include any new line of credit or special dividends. Identify the financing deficit or surplus in this preliminary forecast and then add a new column that shows the final forecast that includes any new line of credit or special dividend.) Begin by calculating the appropriate historical ratios in Column E. Then put these ratios and any other input ratios in Column 2 G -3 Forecast the preliminary balance sheets and income statements in Column H. Don't include any line of credit or special 35 dividend in the preliminary forecast. 36 37 38 After completing the preliminary forecast of the balance sheets and income statement, go to the area below the preliminary 39 forecast and identify the financing deficit or surplus. Then use Excel's IF statements to specify the amount of any new line of 40 credit OR special dividend you should not have a new line of credit AND a special dividend, only one or the other). 41 42 After specifying the amounts of the special dividend or line of credit, create a second column (1) for the final forecast next to 43 the column for the preliminary forecast (H). In this final forecast, be sure to include the effect of the special dividend or line of 44 credit. 45 46 47 Income Statements 2020 Preliminary 18 MacBook Pro esc . ! 1 + 3 % 5 A 6 & 7 2 4 8 9 0 Q W E R T Y U 1 0 A SDF G H K L Z X C V B N M. 1" 9 36 Formatting as Table Style fx special dividend B A D E G H Income Statements: December 31, in thousands of dollars 2019 Historical ratios 2020 Input ratios 2020 Preliminary forecast doesn't Include special dividend or LOC) 2020 Final forecast (includes special dividend or LOC) Forecasting basis Growth % of sales % of fixed assets 2019 3455,150 $386,878 $14,565 $53,708 $11,800 $0 $41,828 $10,457 $25,0BT Sales Expenses (excluding depr. & amort) Depreciation and Amortization EBIT Interest expense on long-term debt Interest expense on line of credit 7 EBT 3 Taxes (25) Not Income 50 51 Common dividends regular dividends) 82 Special dividends 6 Addition to retained earnings 64 65 Balance Sheets 66 December 31, in thousands of dollars) 67 Interest rate x average debt during year 512,554 Growth Zero in preliminary forecast $12.543 2019 Historical 2020 Input 2020 Preliminary forecast doesn't include special dividend or LOC 2019 2020 Final forecast includes special dividend or LOC Forecasting basis ratios Assets 70 Cash Accounts Receivable T2 inventories 73 Total current sets 14 Fwds 75 Total 78 $18,206 3100,133 $45,515 $163,854 $164120 $974 ofes S of sales Model En ty MacBook Pro ! 1 > 2 3 $ 4 5 6 7 8 C 9 a Q W E R T Y U 0 A S D F G H J N V B N M me Insert Draw Page Layout Formulas Data Review View Tell me Arial 10 - A A General he . DO Merge Center 09 Conditional Format Cel Formatting as Table Styles special dividend A C E G H Fixed assets Total assets D USU $364, 120 $527 974 of sales Liabilities and equity Accounts payable $31,861 % of sales Accruals $27,309 of sales D Line of credit 50 Zero in preliminary forecast 1 Total current liable $59,170 2 Long-term debt $120.000 Previous 23 Total abilities $179, 170 34 Common stock $60,000 Previous BS Retained Earnings $106.745 Previous - Addition to retained earnings 186 Totalcommon equity $166,745 B7 Total liabilities and by $345,914 88 89 Identity Financing Deficit or Surplus So 91 Increase in spontaneous abilities (accounts payable and accrual) 82 Increase in long-term bonds preferred stock and common stock 93. Net Income in preliminary forecast)minus regular common dividends Increase in financing - Increase in totales Amount of financing deficit or surplus 90 deficit in financing negative), show the amount for the line of credit 100 surplus in financing positive show the amount of the special dividend 101 102. What are the forecasted levels of the line of credit and special dividends? 109 104 Required ine of credit Notes we copied values from N100when sales growth in Bu Mode Edit 18 tv MacBook Pro esc ! 1 A 2 %23 3 $ 4 % 5 1 6 7 8 W E R T Y U 0 A S D F F G H J K Week 7 Chapter 12 BRU. Page Layout Formulas sme mert D Data Review View Tell me Arial 10-AA B TV . FE) Morge & Carter Conditional Format Cel Formatting Table Styles rent Delen special dividend E H K 02. What are the forecasted levels of the line of credit and special dividends? 100 104 Required line of credin Note: we copied values from Nowhan sales growth in GST 6% 105 Special dividende 9 107. Now assume that the growth in sales is only 3% do this by changing the growth rate in Cell G51) What are the forecasted levels 100 of line of credit and special dividends? 908 190 Required in of credi 11 Special dividende Note: we copied values from 100) when sales growth in 1 - 112 113 114 115 190 117 110 112 190 121 123 131 1:21 127 123 10 131 132 MacBook Pro 1 2 3 4 % 5 6 & 7 8 C 9 0 Q W E 20 T Y U 0 P A ck S DF G H K L N X V B B > NM T * rol option command Start with the partial model in the file Ch 12 P10 Build a Model.xlsx on the textbook's Web site, which contains the 2019 financial statements of Zieber Corporation. Forecast Zeiber's 2020 income statement and balance sheets. Use the following assumptions: (1) Sales grow by 6%. (2) The ratios of expenses to sales, depreciation to fixed assets, cash to sales, accounts receivable to sales, and inventories to sales will be the same in 2020 as in 2019. (3) Zeiber will not issue any new stock or new long-term bonds. (4) The interest rate is 11% for long-term debt and the interest expense on long-term debt is based on the average balance during the year. (5) No interest is earned on cash. (6) Regular dividends grow at an 8% rate. (7) The tax rate is 25%. Calculate the additional funds needed (AFN). If new financing is required, assume it will be raised by drawing on a line of credit with an interest rate of 12%. Assume that any draw on the line of credit will be made on the last day of the year, so there will be no additional interest expense for the new line of credit. If surplus funds are available, pay a special dividend. Key Input Data: Used in the forecast Tax rate 25% Dividend growth rate 8% Rate on notes payable-term debt, Poid 9% Rate on long-term debt, la 11% Rate on line of credit, Ploc 12% a. What are the forecasted levels of the line of credit and special dividends? (Hints: Create a column showing the ratios for the current year, then create a new column showing the ratios used in the forecast. Also, create a preliminary forecast that doesn't include any new line of credit or special dividends. Identify the financing deficit or surplus in this preliminary forecast and then add a new column that shows the final forecast that includes any new line of credit or special dividend.) Begin by calculating the appropriate historical ratios in Column E. Then put these ratios and any other input ratios in Column G. Forecast the preliminary balance sheets and income statements in Column H. Don't include any line of credit or special dividend in the preliminary forecast. After completing the preliminary forecast of the balance sheets and income statement, go to the area below the preliminary forecast and identify the financing deficit or surplus. Then use Excel's IF statements to specify the amount of any new line of credit OR special dividend (you should not have a new line of credit AND a special dividend, only one or the other). After specifying the amounts of the special dividend or line of credit, create a second column (1) for the final forecast next to the column for the preliminary forecast (H). In this final forecast, be sure to include the effect of the special dividend or line of credit. Income Statements: (December 31, in thousands of dollars) 2020 Preliminary forecast (doesn't include special dividend or LOC) 2020 Final forecast (includes special dividend or LOC) Sales Expenses (excluding depr. & amort.) Depreciation and Amortization EBIT Interest expense on long-term debt Interest expense on line of credit EBT Taxes (25%) Net Income 2019 $455,150 $386,878 $14,565 $53,708 $11,880 $0 $41,828 $10,457 $25,097 2019 Historical 2020 Input ratios Forecasting basis ratios Growth % of sales % of fixed assets Interest rate x average debt during year $12,554 Common dividends (regular dividends) Special dividends Addition to retained earnings Growth Zero in preliminary forecast $12,543 Balance Sheets (December 31, in thousands of dollars) 2019 Historical ratios 2020 Input ratios 2020 Preliminary forecast (doesn't include special dividend or LOC) 2020 Final forecast (includes special dividend or LOC) 2019 Assets: Cash Accounts Receivable Inventories Total current assets Fixed assets Total assets $18,206 $100,133 $45,515 $163,854 $364,120 $527,974 Forecasting basis % of sales % of sales % of sales % of sales Liabilities and equity Accounts payable Accruals Line of credit Total current liabilities Long-term debt Total liabilities Common stock Retained Earnings Total common equity Total liabilities and equity $31,861 % of sales $27,309 % of sales $0 Zero in preliminary forecast $59,170 $120,000 Previous $179,170 $60,000 Previous $106,745 Previous + Addition to retained earnings $166,745 $345,914 Identify Financing Deficit or Surplus Increase in spontaneous liabilities (accounts payable and accruals) + Increase in long-term bonds, preferred stock and common stock + Net income in preliminary forecast) minus regular common dividends Increase in financing - Increase in total assets Amount of financing deficit or surplus: If deficit in financing (negative), show the amount for the line of credit If surplus in financing (positive), show the amount of the special dividend 1. What are the forecasted levels of the line of credit and special dividends? Required ine of credit Note: we copied values from H99:H100) when sales growth in G51 -6%. Special dividends b. Now assume that the growth in sales is only 3% (do this by changing the growth rate in Cell G51). What are the forecasted levels of line of credit and special dividends? Required ine of credit Note: we copied values from H99:H100) when sales growth in G51 - 3%. Special dividends 3 Merge & Center B1 fx B C D E G H 4 5 Start with the partial model in the file Ch12 P10 Build a Model.xlsx on the textbook's Web site, which contains the 2019 financial statements of Zieber Corporation. Forecast Zeiber's 2020 Income statement and balance sheets. Use the following assumptions: (1) Sales grow by 6% (2) The ratio of expenses to sales, depreciation to fixed assets, cash to sales, accounts 9 receivable to sales, and inventories to sales will be the same in 2020 as in 2019.) Zelber will not issue any new stock or 10 11 new long-term bonds. (4) The Interest rate is 11% for long term debt and the interest expense on long-term debt is based on the 12 average balance during the year. (5) No interest is earned on cash. (6) Regular dividends grow at an 8% rate.) The tax rate is 25%. Calculate the additional funds needed (AFN). If new financing is required, assume it will be raised by drawing on a line of 13 14 credit with an interest rate of 12%. Assume that any draw on the line of credit will be made on the last day of the year, so there will be no additional interest expense for the new line of credit. If surplus funds are available, pay a special dividend. 15 16 17 Key Input Data: Used in the 18 forecast 19 Tax rate 25% 20 Dividend growth rate 8% 21 Rate on notes payable-term debt. 9% 22 Rate on long-term debt.ro 11% 23 Rate on line of credit. Fuoc 12% 24 25 26 . What are the forecasted levels of the line of credit and special dividends? Hints: Create a column showing the ratios for the 27 current year, then create a new column showing the ratios used in the forecast Also, create a preliminary forecast that 28 doesn't include any new line of credit or special dividends. Identity the financing deficit or surplus in this preliminary forecast 29 and then add a new column that shows the final forecast that includes any new line of credit or special dividend.) 30 31 Begin by calculating the appropriate historical ratios in Column E. Then put these ratios and any other input ratios in Column 32 G 33 34 Forecast the preliminary balance sheets and income statements in Column H. Don't include any line of credit or special 35 dividend in the preliminary forecast 36 37 38 After completing the preliminary forecast of the balance sheets and income statement go to the area below the preliminary 39 forecast and identity the financing deficit or surplus. Then use Excel's IF statements to specify the amount of any new line of 40 credit OR special dividend you should not have a new line of credit AND a special dividend, only one or the other). 42 Aer specifying the amounts of the special dividend or line of credit, create a second column (1) for the final forecast next to 43 the column for the preliminary forecast (H). In this final forecast, be sure to include the effect of the special dividend or line of 44 credit 45 Build a Model 16 ctv B1 D E H 2019 Historical ratios 2020 Input ratios 2020 Preliminary forecast doesn't Include special dividend or LOC) 2020 Final forecast (Includes special dividend or LOC) Forecasting basis Growth % of sales % of fixed assets 2019 $455,150 $386,878 $14,565 $53,708 $11,880 50 $41,828 $10,457 $25,097 Interest rate x average debt during year $12,554 Growth Zero in preliminary forecast $12.543 B 46 47 Income Statements: 48 (December 31, in thousands of dollars) 49 50 51 Sales 52 Expenses (excluding depr. & amort) 53 Depreciation and Amortization 54 EBIT 55 Interest expense on long-term debt 56 Interest expense on line of credit 57 EBT 58 Taxes (25%) 59 Net Income 60 61 Common dividends (regular dividends) 62 Special dividends 63 Addition to retained earnings 64 65 Balance Sheets 66 (December 31, in thousands of dollars) 67 68 69 Assets 70 Cash 71 Accounts Receivable 72 Inventories 73 Total current assets 74 Fixed assets 75 Total assets 76 77 Liabilities and equity 78 Accounts payable 79 Accruals 80 Line of credit 81 Total current liabilities 82 Long-term debt Total liabilities 84 Common stock 85 Retained Earnings 86 Total common equity 87 Total liabilities and equity 88 2019 Historical ratios 2020 Preliminary forecast doesn't Include special dividend or LOC 2020 Final forecast Includes special dividend or LOC) 2020 Input ratios 2010 Forecasting basis % of sales % of sales % of sales $10,206 $100,133 $45 515 $163,854 $364, 120 5527,974 % of sales % of sales % of sales Zoro in preliminary forecast $31,861 $27,309 $0 $59,170 $120,000 $179,170 $60,000 $106.745 $166,745 $345,914 Previous Previous Previous + Addition to retained earnings Build a Model Paste B IV Merge & Center $ %) Condit Forma B1 B D E G H K 89 Identify Financing Deficit or Surplus 90 91 Increase in spontaneous liabilities (accounts payable and accruals) 92 - Increase in long-term bonds, preferred stock and common stock 93 - Net Income (in preliminary forecast) minus regular common dividends 94 Increase in financing 95 96 - Increase in total assets 97 Amount of financing deficit or surplus: 98 99 i deficit in financing (negative), show the amount for the line of credit 100 of surplus in financing positive), show the amount of the special dividend 101 102 a. What are the forecasted levels of the line of credit and special dividends? 103 104 Required ine of credit Note: we copied values from 199H100) when sales growth in 651 - 6% 105 Special dividends 106 107 b. Now assume that the growth in sales is only 3% (do this by changing the growth rate in Cell G51) What are the forecasted 108 levels of line of credit and special dividends? 100 110 Required ine of credit Note: We copled values from 99 H100) when sales growth in 051-3% 111 Special dividends 112 113 114 115 116 117 118 119 120 121 122 123 124 125 126 127 128 129 130 Build a Model E Merge & Center v B1 G A B C E F H 2 Chapter: 12 3 Problem: 10 4 5 6 Start with the partial model in the file Ch12 P10 Build a Model.xlsx on the textbook's Web site, which contains the 2019 7 financial statements of Zieber Corporation. Forecast Zeiber's 2020 Income statement and balance sheets. Use the following 8 assumptions: (1) Sales grow by 6%. (2) The ratios of expenses to sales, depreciation to fixed assets, cash to sales, accounts receivable to sales, and inventories to sales will be the same in 2020 as in 2019. (3) Zeiber will not issue any new stock or 10 new long-term bonds. (4) The interest rate is 11% for long-term debt and the interest expense on long-term debt is based on the 11 average balance during the year. (5) No interest is earned on cash. (6) Regular dividends grow at an 8% rate. (7) The tax rate is 25%. Calculate the additional funds needed (AFN). If new financing is required, assume it will be raised by drawing on a line of credit with an interest rate of 12%. Assume that any draw on the line of credit will be made on the last day of the year, so there will be no additional Interest expense for the new line of credit. If surplus funds are available, pay a special dividend. 6 7 Key Input Data: Used in the 8 forecast 9 Tax rate 25% Co Dividend growth rate 8% 1 Rate on notes payable-term debt, und 9% 2 Rate on long-term debt, 11% 3 Rate on line of credit, Floc 12% 4 5 6 a. What are the forecasted levels of the line of credit and special dividends ? (Hints: Create a column showing the ratios for the 7 current year, then create a new column showing the ratios used in the forecast. Also, create a preliminary forecast that 8 doesn't include any new line of credit or special dividends. Identify the financing deficit or surplus in this preliminary forecast 9 and then add a new column that shows the final forecast that includes any new line of credit or special dividend.) 0 #1 Begin by calculating the appropriate historical ratios in Column E. Then put these ratios and any other input ratios in Column 2 G. 3 B1 B E A D E F H 16 17 Key Input Data: Used in the 18 forecast 19 Tax rate 25% 20 Dividend growth rate 8% 21 Rate on notes payable-term debt, Ford 9% 22 Rate on long-term debt, ra 11% 23 Rate on line of credit, roc 12% 24 25 26 a. What are the forecasted levels of the line of credit and special dividends ? (Hints: Create a column showing the ratios for the 27 current year, then create a new column showing the ratios used in the forecast. Also, create a preliminary forecast that 28 doesn't include any new line of credit or special dividends. Identify the financing deficit or surplus in this preliminary forecast 29 and then add a new column that shows the final forecast that includes any new line of credit or special dividend.) 10 1 Begin by calculating the appropriate historical ratios in Column E. Then put these ratios and any other input ratios in Column 12 G. 13 4 Forecast the preliminary balance sheets and income statements in Column H. Don't include any line of credit or special 15 dividend in the preliminary forecast. 16 7 18 After completing the preliminary forecast of the balance sheets and income statement, go to the area below the preliminary 9 forecast and identify the financing deficit or surplus. Then use Excel's IF statements to specify the amount of any new line of O credit OR special dividend (you should not have a new line of credit AND a special dividend, only one or the other). 1 2 After specifying the amounts of the special dividend or line of credit, create a second column (1) for the final forecast next to 3 the column for the preliminary forecast (H). In this final forecast, be sure to include the effect of the special dividend or line of 14 credit. 15 16 7 Incama Satamant 2020 Preliminary 31 D E 2020 Preliminary forecast (doesn't Include special dividend or LOC 2020 Final forecast (includes special dividend or LOC) 2019 Historical 2020 Input 2019 ratios Forecasting basis ratios $455,150 Growth $386,878 % of sales $14,565 % of fixed assets $53,708 $11,880 Interest rate x average debt during year $0 $41,828 $10,457 $25,097 $12,554 Growth Zero in preliminary forecast $12,543 B 45 46 47 Income Statements: 48 (December 31, in thousands of dollars) 49 50 51 Sales 52 Expenses (excluding depr. & amort) 53 Depreciation and Amortization 54 EBIT 55 Interest expense on long-term debt 56 Interest expense on line of credit 57 EBT 58 Taxes (25%) 59 Net Income 60 61 Common dividends (regular dividends) 62 Special dividends 63 Addition to retained earnings 64 65 Balance Sheets 66 (December 31, in thousands of dollars) 67 68 69 Assets: 70 Cash 71 Accounts Receivable 72 Inventories 73 Total current assets 74 Fixed assets 75 Total assets 76 77 Liabilities and equity 78 Accounts payable 79 Accruals 80 Line of credit 81 Total current liabilities 82 Long-term debt 83 Total liabilities 84 Common stock 85 Retained Earnings 86 Total common equity 87 Total liabilities and equity 2019 Historical ratios 2020 Preliminary forecast doesn't Include special dividend or LOC) 2020 Final forecast (includes special dividend or LOC) 2020 Input ratios 2010 Forecasting basis % of sales % of sales % of sales $18,206 $100,133 $45,515 $163,854 $364,120 $527,974 % of sales % of sales % of sales Zero in preliminary forecast $31,861 $27,309 $0 $59,170 $120,000 $179,170 $60,000 $106.745 5166, 745 $345,914 Previous Previous Previous + Addition to retained earnings AutoSave OFF BESU. Week 7 Chapter 12 Home Insert Draw Page Layout Formulas Data Review View Tell me Arial 10 A A 2. Wrap Text General Paste BIU EE Merge & Center $ %, 8:09 Conc Form B1 XV fx D E F G 86 Total common equity $166,745 87 Total liabilities and equity $345,914 BB 89 Identify Financing Deficit or Surplus 190 91 Increase in spontaneous liabilities (accounts payable and accruals) 92 + Increase in long-term bonds, preferred stock and common stock 93 Net income (in preliminary forecast) minus regular common dividends Increase in financing 195 196 - Increase in total assets 97 Amount of financing deficit or surplus: 98 99 I deficit in financing (negative), show the amount for the line of credit 100 of surplus in financing foositive), show the amount of the special dividend 101 102 a. What are the forecasted levels of the line of credit and special dividends? 103 104 Required ine of credit Note: we copied values from H99:H100) when sales growth in G51 - 6% 105 Special dividends 106 107 b. Now assume that the growth in sales is only 3% (do this by changing the growth rate in Cell G51). What are the forecasted 10B levels of line of credit and special dividends? 109 110 Required ine of credit Note: we copied values from H99:H100) when sales growth in 651 - 3% 111 Special dividends 112 113 114 115 116 117 118 119 120 9 B D E F H Start with the partial model in the file Ch12 P10 Build a Model.xlsx on the textbook's Web site, which contains the 2019 financial statements of Zieber Corporation. Forecast Zeiber's 2020 income statement and balance sheets. Use the following 8 assumptions: (1) Sales grow by 6%. (2) The ratios of expenses to salos, depreciation receivable to sales, and Inventories to sales will be the same in 2020 as in 2019. (3) Zeiber will not issue any new stock or fixed assets, cash to sales, accounts 10 11 new long-term bonds. (4) The Interest rate is 11% for long-term debt and the interest expense on long-term debt is based on the 12 average balance during 6 year. (5) No interest is earned on cash. (6) Regular dividends grow at an 8% rate (7) The tax rate is 25%. Calculate the additional funds needed (AFN). If new financing is required, assume it will be raised by drawing on a line of 13 14 credit with an interest rate of 12%. Assume that any draw on the line of credit will be made on the last day of the year, so there 15 will be no additional interest expense for the new line of credit. If surplus funds are available, pay a special dividend. 16 17 Key Input Data: Used in the 18 forecast 19 Tax rate 25% 20 Dividend growth rate 8% 21 Rate on notes payable-term debt, 9% 22 Rate on long-term debt, a 11% 23 Rate on line of credit, Poc 12% 24 25 26 a. What are the forecasted levels of the line of credit and special dividends ? (Hints: Create a column showing the ratios for the 27 current year; then create a new column showing the ratios used in the forecast. Also, create a preliminary forecast that 28 doesn't include any new line of credit or special dividends. Identify the financing deficit or surplus in this preliminary forecast 29 and then add a new column that shows the final forecast that includes any new line of credit or special dividend.) 30 31 Begin by calculating the appropriate historical ratios in Column E. Then put these ratios and any other input ratios in Column 32 G. 33 34 Forecast the preliminary balance sheets and income statements in Column H. Don't include any line of credit or special 35 dividend in the preliminary forecast 36 37 38 After completing the preliminary forecast of the balance sheets and income statement, go to the area below the preliminary 39 forecast and identify the financing deficit or surplus. Then use Excel's IF statements to specify the amount of any new line of 40 credit OR special dividend you should not have a new line of credit AND a special dividend, only one or the other). 41 42 After specifying the amounts of the special dividend or line of credit, create a second column (l) for the final forecast next to 43 the column for the preliminary forecast (H). In this final forecast, be sure to include the effect of the special dividend or line of 44 credit B D E H 2019 Historical ratios 2020 Input 2020 Preliminary forecast (doesn't Include special dividend or LOC) 2020 Final forecast (includes special dividend or LOC ratios Forecasting basis Growth % of sales % of fixed assets 2019 $455,150 $386,878 $14,565 $53,708 $11,880 SO $41,828 $10,457 $25,097 Interest rate x average debt during year $12,554 Growth Zero in preliminary forecast $12,543 46 47 Income Statements: 48 (December 31, in thousands of dollars) 49 50 51 Sales 52 Expenses (excluding depr. & amort.) 53 Depreciation and Amortization 54 EBIT 55 Interest expense on long-term debt 56 Interest expense on line of credit 57 EBT 58 Taxes (25%) 59 Net Income 60 61 Common dividends (regular dividends) 62 Special dividends 63 Addition to retained earnings 64 65 Balance Sheets 66 (December 31, in thousands of dollars) 67 68 69 Assets: 70 Cash 71 Accounts Receivable 72 Inventories 73 Total current assets 74 Fixed assets 75 Total assets 76 77 Liabilities and equity 78 Accounts payable 79 Accruals 80 Line of credit 81 Total current liabilities B2 Long-term debt 83 Total liabilities 84 Common stock 85 Retained Earnings 86 Total common equity 87 Total liabilities and equity AR 2019 Historical ratios 2020 Preliminary forecast (doesn't include special dividend or LOC 2020 Final forecast includes special dividend or LOC) 2020 Input ratios 2019 Forecasting basis % of sales % of sales % of sales $18,206 $100,133 $45,515 $163,854 $364,120 $527,974 % of sales % of sales % of sales Zero in preliminary forecast Previous $31,861 $27,309 $0 $59,170 $120,000 $179,170 $60,000 $106,745 $166 745 $345,914 Previous Previous + Addition to retained earnings Home HUU Upel 12 Insert Draw Page Layout Formulas Data Review View Tell me Arial 10 A A 2 Wrap Text General Paste BIU E Merge & Center Conditional Formatting B1 x v fx D G H 89 Identify Financing Deficit or Surplus 90 91 Increase in spontaneous liabilities (accounts payable and accruals) 92 - Increase in long-term bonds, preferred stock and common stock 93 - Net Income in preliminary forecast) minus regular common dividends 94 Increase in financing + 95 96 - Increase in total assets 97 Amount of financing deficit or surplus: 98 99 If deficit in financing (negative), show the amount for the line of credit 100 of surplus in financing positive), show the amount of the special dividend 101 102 a. What are the forecasted levels of the line of credit and special dividends? 103 104 Required ine of credit Note: We copled values from H99-1100) when sales growth in G518% 105 Special dividends 106 107 b. Now assume that the growth in sales is only 3% (do this by changing the growth rate in Cell G51). What are the forecasted 108 levels of line of credit and special dividends? 109 110 Required ine of credit Note: we copied values from H99-H100) when sales growth in 051-3% 111 Special dividends 112 113 114 115 116 117 118 119 120 121 122 123 124 125 126 127 128 25 26 a. What are the forecasted levels of the line of credit and special dividends ? (Hints: Create a column showing the ratios for the 27 current year, then create a new column showing the ratios used in the forecast. Also, create a preliminary forecast that doesn't 28 include any new line of credit or special dividends. Identify the financing deficit or surplus in this preliminary forecast and then 29 add a new column that shows the final forecast that includes any new line of credit or special dividend.) 30 30 31 32 Begin by calculating the appropriate historical ratios in Column E. Then put these ratios and any other input ratios in Column G. 33 34 Forecast the preliminary balance sheets and income statements in Column H. Don't include any line of credit or special dividend 35 in the preliminary forecast. 36 37 38 After completing the preliminary forecast of the balance sheets and income statement, go to the area below the preliminary 39 forecast and identify the financing deficit or surplus. Then use Excel's IF statements to specify the amount of any new line of 40 credit OR special dividend (you should not have a new line of credit AND a special dividend, only one or the other). 41 42 After specifying the amounts of the special dividend or line of credit, create a second column (1) for the final forecast next to the 43 column for the preliminary forecast (H). In this final forecast, be sure to include the effect of the special dividend or line of 44 credit. 45 102. What are the forecasted levels of the line of credit and special dividends? 103 104 Required ine of credit Note: we copied values from H99:H100) when sales growth in G51 = 6% 105 Special dividends 106 107 6. Now assume that the growth in sales is only 3% (do this by changing the growth rate in Cell 651). What are the forecasted 100 levels of line of credit and special dividends? 109 110 Required ine of credit Note: we copled values from H99:H100) when sales growth in 051 - 3% 111 Special dividends 112 113 114 115 BON Excel File Edit View Insert Formal Tools Data Window Help e Auta BU. Week 7 Chapter 12 Intent Dram Page Layout Formulas Data View Tell me Arla - A A Insert Cell Forming Table Styles Format X special dividend. B D E F G H a. What are the forecasted levels of the line of credit and special dividends? (Hints: Create a column showing the ratios for the current year, then create a new column showing the ratios used in the forecast. Also, create a preliminary forecast that doesn't include any new line of credit or special dividends. Identify the financing deficit or surplus in this preliminary forecast and then add a new column that shows the final forecast that includes any new line of credit or special dividend.) Begin by calculating the appropriate historical ratios in Column E. Then put these ratios and any other input ratios in Column 2 G -3 Forecast the preliminary balance sheets and income statements in Column H. Don't include any line of credit or special 35 dividend in the preliminary forecast. 36 37 38 After completing the preliminary forecast of the balance sheets and income statement, go to the area below the preliminary 39 forecast and identify the financing deficit or surplus. Then use Excel's IF statements to specify the amount of any new line of 40 credit OR special dividend you should not have a new line of credit AND a special dividend, only one or the other). 41 42 After specifying the amounts of the special dividend or line of credit, create a second column (1) for the final forecast next to 43 the column for the preliminary forecast (H). In this final forecast, be sure to include the effect of the special dividend or line of 44 credit. 45 46 47 Income Statements 2020 Preliminary 18 MacBook Pro esc . ! 1 + 3 % 5 A 6 & 7 2 4 8 9 0 Q W E R T Y U 1 0 A SDF G H K L Z X C V B N M. 1" 9 36 Formatting as Table Style fx special dividend B A D E G H Income Statements: December 31, in thousands of dollars 2019 Historical ratios 2020 Input ratios 2020 Preliminary forecast doesn't Include special dividend or LOC) 2020 Final forecast (includes special dividend or LOC) Forecasting basis Growth % of sales % of fixed assets 2019 3455,150 $386,878 $14,565 $53,708 $11,800 $0 $41,828 $10,457 $25,0BT Sales Expenses (excluding depr. & amort) Depreciation and Amortization EBIT Interest expense on long-term debt Interest expense on line of credit 7 EBT 3 Taxes (25) Not Income 50 51 Common dividends regular dividends) 82 Special dividends 6 Addition to retained earnings 64 65 Balance Sheets 66 December 31, in thousands of dollars) 67 Interest rate x average debt during year 512,554 Growth Zero in preliminary forecast $12.543 2019 Historical 2020 Input 2020 Preliminary forecast doesn't include special dividend or LOC 2019 2020 Final forecast includes special dividend or LOC Forecasting basis ratios Assets 70 Cash Accounts Receivable T2 inventories 73 Total current sets 14 Fwds 75 Total 78 $18,206 3100,133 $45,515 $163,854 $164120 $974 ofes S of sales Model En ty MacBook Pro ! 1 > 2 3 $ 4 5 6 7 8 C 9 a Q W E R T Y U 0 A S D F G H J N V B N M me Insert Draw Page Layout Formulas Data Review View Tell me Arial 10 - A A General he . DO Merge Center 09 Conditional Format Cel Formatting as Table Styles special dividend A C E G H Fixed assets Total assets D USU $364, 120 $527 974 of sales Liabilities and equity Accounts payable $31,861 % of sales Accruals $27,309 of sales D Line of credit 50 Zero in preliminary forecast 1 Total current liable $59,170 2 Long-term debt $120.000 Previous 23 Total abilities $179, 170 34 Common stock $60,000 Previous BS Retained Earnings $106.745 Previous - Addition to retained earnings 186 Totalcommon equity $166,745 B7 Total liabilities and by $345,914 88 89 Identity Financing Deficit or Surplus So 91 Increase in spontaneous abilities (accounts payable and accrual) 82 Increase in long-term bonds preferred stock and common stock 93. Net Income in preliminary forecast)minus regular common dividends Increase in financing - Increase in totales Amount of financing deficit or surplus 90 deficit in financing negative), show the amount for the line of credit 100 surplus in financing positive show the amount of the special dividend 101 102. What are the forecasted levels of the line of credit and special dividends? 109 104 Required ine of credit Notes we copied values from N100when sales growth in Bu Mode Edit 18 tv MacBook Pro esc ! 1 A 2 %23 3 $ 4 % 5 1 6 7 8 W E R T Y U 0 A S D F F G H J K Week 7 Chapter 12 BRU. Page Layout Formulas sme mert D Data Review View Tell me Arial 10-AA B TV . FE) Morge & Carter Conditional Format Cel Formatting Table Styles rent Delen special dividend E H K 02. What are the forecasted levels of the line of credit and special dividends? 100 104 Required line of credin Note: we copied values from Nowhan sales growth in GST 6% 105 Special dividende 9 107. Now assume that the growth in sales is only 3% do this by changing the growth rate in Cell G51) What are the forecasted levels 100 of line of credit and special dividends? 908 190 Required in of credi 11 Special dividende Note: we copied values from 100) when sales growth in 1 - 112 113 114 115 190 117 110 112 190 121 123 131 1:21 127 123 10 131 132 MacBook Pro 1 2 3 4 % 5 6 & 7 8 C 9 0 Q W E 20 T Y U 0 P A ck S DF G H K L N X V B B > NM T * rol option command Start with the partial model in the file Ch 12 P10 Build a Model.xlsx on the textbook's Web site, which contains the 2019 financial statements of Zieber Corporation. Forecast Zeiber's 2020 income statement and balance sheets. Use the following assumptions: (1) Sales grow by 6%. (2) The ratios of expenses to sales, depreciation to fixed assets, cash to sales, accounts receivable to sales, and inventories to sales will be the same in 2020 as in 2019. (3) Zeiber will not issue any new stock or new long-term bonds. (4) The interest rate is 11% for long-term debt and the interest expense on long-term debt is based on the average balance during the year. (5) No interest is earned on cash. (6) Regular dividends grow at an 8% rate. (7) The tax rate is 25%. Calculate the additional funds needed (AFN). If new financing is required, assume it will be raised by drawing on a line of credit with an interest rate of 12%. Assume that any draw on the line of credit will be made on the last day of the year, so there will be no additional interest expense for the new line of credit. If surplus funds are available, pay a special dividend. Key Input Data: Used in the forecast Tax rate 25% Dividend growth rate 8% Rate on notes payable-term debt, Poid 9% Rate on long-term debt, la 11% Rate on line of credit, Ploc 12% a. What are the forecasted levels of the line of credit and special dividends? (Hints: Create a column showing the ratios for the current year, then create a new column showing the ratios used in the forecast. Also, create a preliminary forecast that doesn't include any new line of credit or special dividends. Identify the financing deficit or surplus in this preliminary forecast and then add a new column that shows the final forecast that includes any new line of credit or special dividend.) Begin by calculating the appropriate historical ratios in Column E. Then put these ratios and any other input ratios in Column G. Forecast the preliminary balance sheets and income statements in Column H. Don't include any line of credit or special dividend in the preliminary forecast. After completing the preliminary forecast of the balance sheets and income statement, go to the area below the preliminary forecast and identify the financing deficit or surplus. Then use Excel's IF statements to specify the amount of any new line of credit OR special dividend (you should not have a new line of credit AND a special dividend, only one or the other). After specifying the amounts of the special dividend or line of credit, create a second column (1) for the final forecast next to the column for the preliminary forecast (H). In this final forecast, be sure to include the effect of the special dividend or line of credit. Income Statements: (December 31, in thousands of dollars) 2020 Preliminary forecast (doesn't include special dividend or LOC) 2020 Final forecast (includes special dividend or LOC) Sales Expenses (excluding depr. & amort.) Depreciation and Amortization EBIT Interest expense on long-term debt Interest expense on line of credit EBT Taxes (25%) Net Income 2019 $455,150 $386,878 $14,565 $53,708 $11,880 $0 $41,828 $10,457 $25,097 2019 Historical 2020 Input ratios Forecasting basis ratios Growth % of sales % of fixed assets Interest rate x average debt during year $12,554 Common dividends (regular dividends) Special dividends Addition to retained earnings Growth Zero in preliminary forecast $12,543 Balance Sheets (December 31, in thousands of dollars) 2019 Historical ratios 2020 Input ratios 2020 Preliminary forecast (doesn't include special dividend or LOC) 2020 Final forecast (includes special dividend or LOC) 2019 Assets: Cash Accounts Receivable Inventories Total current assets Fixed assets Total assets $18,206 $100,133 $45,515 $163,854 $364,120 $527,974 Forecasting basis % of sales % of sales % of sales % of sales Liabilities and equity Accounts payable Accruals Line of credit Total current liabilities Long-term debt Total liabilities Common stock Retained Earnings Total common equity Total liabilities and equity $31,861 % of sales $27,309 % of sales $0 Zero in preliminary forecast $59,170 $120,000 Previous $179,170 $60,000 Previous $106,745 Previous + Addition to retained earnings $166,745 $345,914 Identify Financing Deficit or Surplus Increase in spontaneous liabilities (accounts payable and accruals) + Increase in long-term bonds, preferred stock and common stock + Net income in preliminary forecast) minus regular common dividends Increase in financing - Increase in total assets Amount of financing deficit or surplus: If deficit in financing (negative), show the amount for the line of credit If surplus in financing (positive)
Step by Step Solution
There are 3 Steps involved in it

Get step-by-step solutions from verified subject matter experts