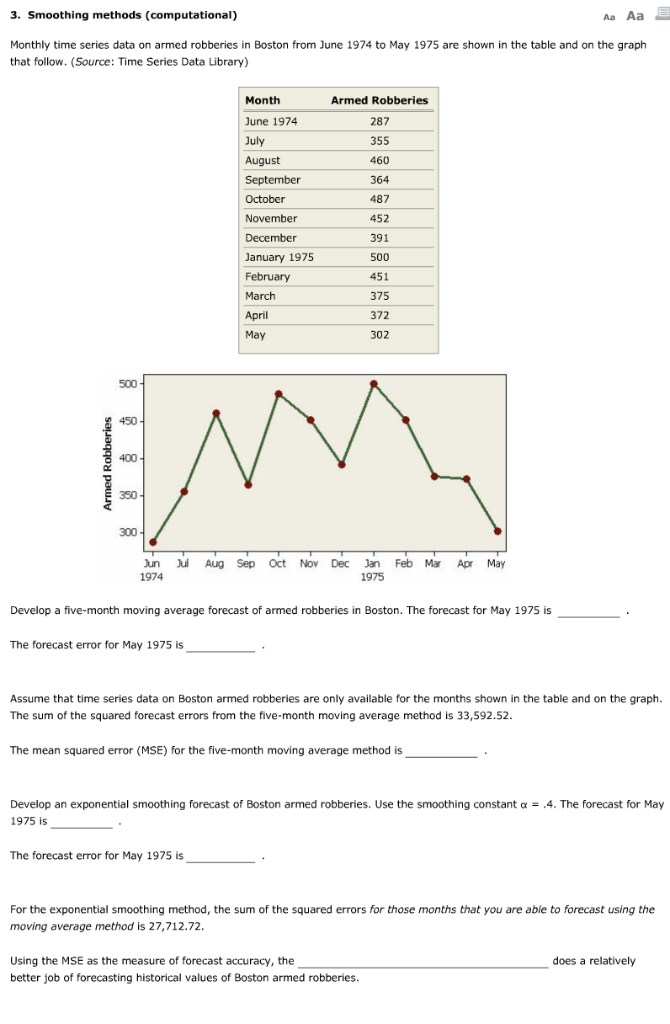
3. Smoothing methods (computational) Aa Aa Monthly time series data on armed robberies in Boston from June 1974 to May 1975 are shown in the table and on the graph that follow. (Source: Time Series Data Library) Month June 1974 July August Armed Robberies 287 355 460 364 487 452 391 500 451 375 372 302 October November December January 1975 March April May 450 400 350 300 un ul Aug Sep Oct Nov Dec an Feb Mar Apr May 1974 1975 Develop a five-month moving average forecast of armed robberies in Boston. The forecast for May 1975 is The forecast error for May 1975 is Assume that time series data on Boston armed robberies are only available for the months shown in the table and on the graph The sum of the squared forecast errors from the five-month moving average method is 33,592.52 The mean squared error (MSE) for the five-month moving average method is Develop an exponential smoothing forecast of Boston armed robberies. Use the smoothing constant = .4. The forecast for May 1975 is The forecast error for May 1975 is For the exponential smoothing method, the sum of the squared errors for those months that you are able to forecast using the moving average method is 27,712.72 Using the MSE as the measure of forecast accuracy, the better job of forecasting historical values of Boston armed robberies. does a relatively 3. Smoothing methods (computational) Aa Aa Monthly time series data on armed robberies in Boston from June 1974 to May 1975 are shown in the table and on the graph that follow. (Source: Time Series Data Library) Month June 1974 July August Armed Robberies 287 355 460 364 487 452 391 500 451 375 372 302 October November December January 1975 March April May 450 400 350 300 un ul Aug Sep Oct Nov Dec an Feb Mar Apr May 1974 1975 Develop a five-month moving average forecast of armed robberies in Boston. The forecast for May 1975 is The forecast error for May 1975 is Assume that time series data on Boston armed robberies are only available for the months shown in the table and on the graph The sum of the squared forecast errors from the five-month moving average method is 33,592.52 The mean squared error (MSE) for the five-month moving average method is Develop an exponential smoothing forecast of Boston armed robberies. Use the smoothing constant = .4. The forecast for May 1975 is The forecast error for May 1975 is For the exponential smoothing method, the sum of the squared errors for those months that you are able to forecast using the moving average method is 27,712.72 Using the MSE as the measure of forecast accuracy, the better job of forecasting historical values of Boston armed robberies. does a relatively


