3. The clustered bar graph below was created between the variables q21 and q18. You will need to calculate the exact counts for the bars
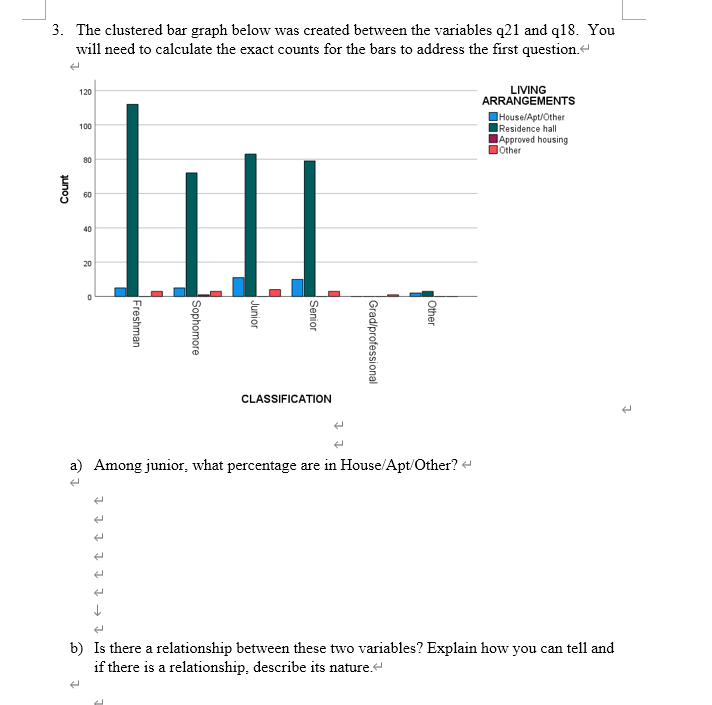
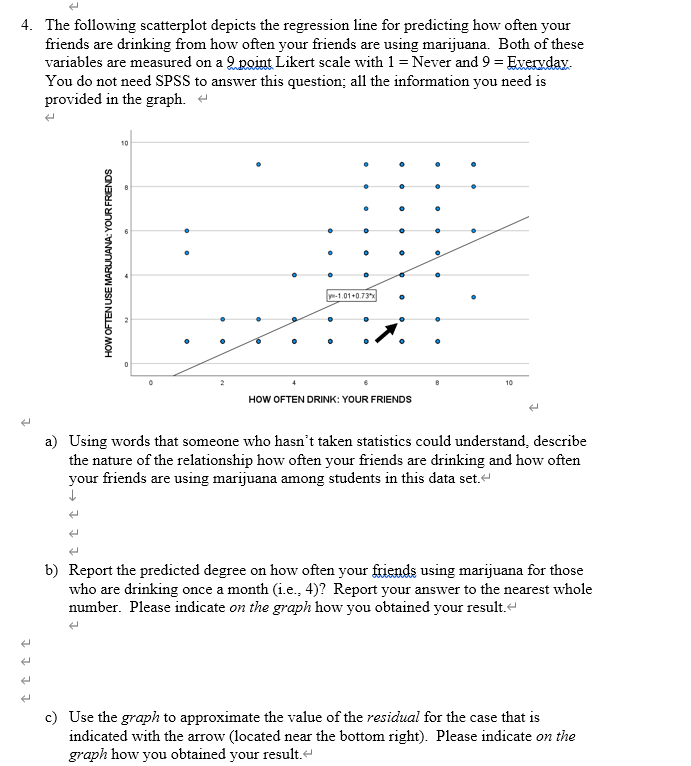
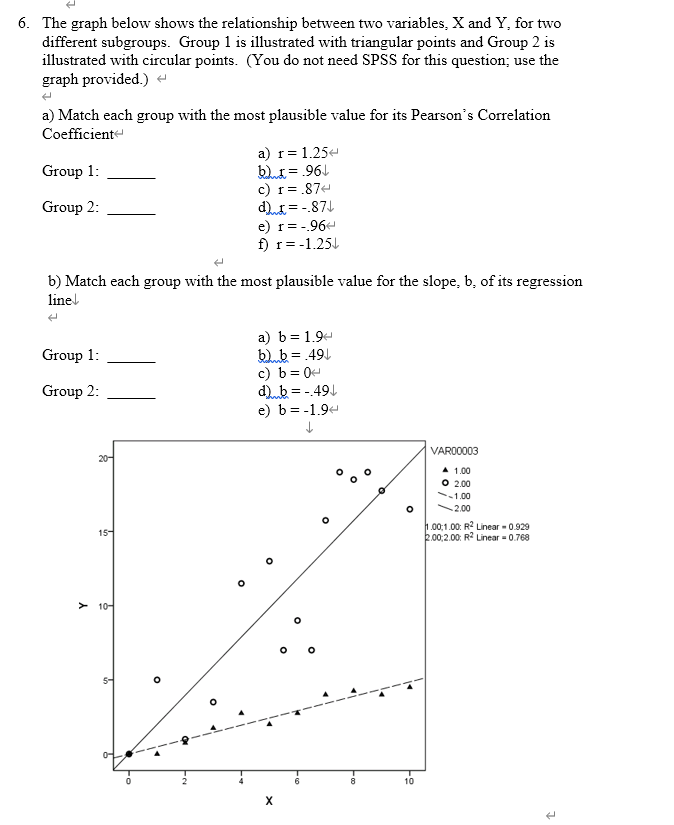
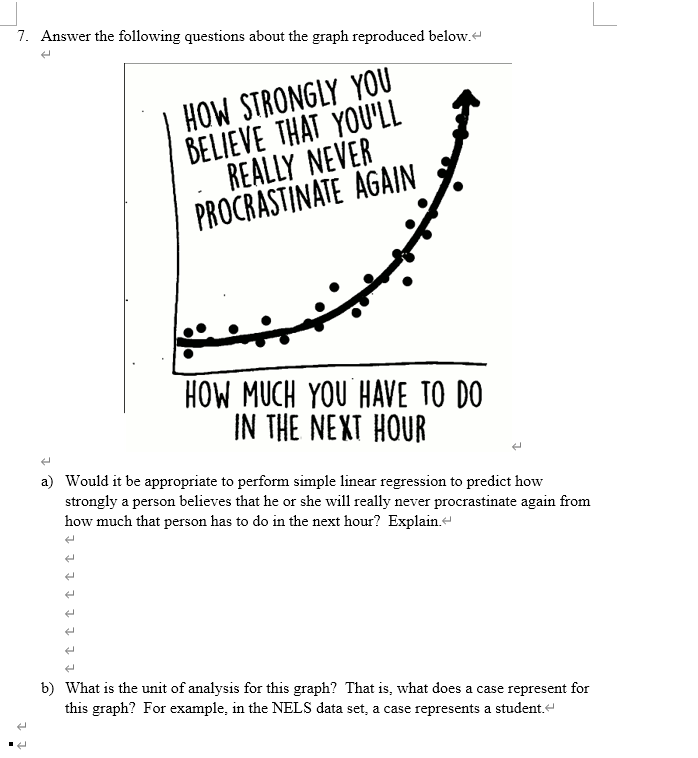
3. The clustered bar graph below was created between the variables q21 and q18. You will need to calculate the exact counts for the bars to address the first question.~ 120 LIVING ARRANGEMENTS House/Apt/Other 100 Residence hall Approved housing Other 80 Count 60 40 70 Other Junior Senior Freshman Sophomore Grad/professional CLASSIFICATION a) Among junior, what percentage are in House/Apt/Other? ~ It t b) Is there a relationship between these two variables? Explain how you can tell and if there is a relationship, describe its nature.~4. The following scatterplot depicts the regression line for predicting how often your friends are drinking from how often your friends are using marijuana. Both of these variables are measured on a 2 point Likert scale with 1 = Never and 9 = Everyday. You do not need SPSS to answer this question; all the information you need is provided in the graph. ~ HOW OFTEN USE MARIJUANA: YOUR FRIENDS -1,01+0.732 HOW OFTEN DRINK: YOUR FRIENDS a) Using words that someone who hasn't taken statistics could understand, describe the nature of the relationship how often your friends are drinking and how often your friends are using marijuana among students in this data set. t b) Report the predicted degree on how often your friends using marijuana for those who are drinking once a month (i.e., 4)? Report your answer to the nearest whole number. Please indicate on the graph how you obtained your result.~ ttt c) Use the graph to approximate the value of the residual for the case that is indicated with the arrow (located near the bottom right). Please indicate on the graph how you obtained your result. ~5. There is a composite score, not included in the data set, asking students to rate the overall satisfaction of Drew's COVID-19 response. Its distribution is approximately normally distributed with a mean of 4.51 and a standard deviation of 1.82. This variable was measured on a seven point Likert Scale with 1 = very poor, 2 = poor; 3 = fair, 4 = good. 5 = very good, 6 = excellent, and 7 = exceptional. In this question, you will use the standard normal distribution summarized by the Excel calculator to approximate the actual distribution of responses. a) Approximate the proportion (or percentage) of Drew students in the data set who gave a response of 3 or less, that is who thought that the overall value was very poor or poor or fair. + t b) Approximate the response that is at the 80 percentile for these Drew students. Your answer does not have to be a whole number. I ttt ttitt c) Approximate the proportion (or percentage) of Drew students in the data set who gave a response 6 or above, that is who thought that the overall value was excellent or exceptional. +6. The graph below shows the relationship between two variables, X and Y, for two different subgroups. Group 1 is illustrated with triangular points and Group 2 is illustrated with circular points. (You do not need SPSS for this question; use the graph provided.) ~ a) Match each group with the most plausible value for its Pearson's Correlation Coefficient a) r = 1.25+ Group 1: bir= 964 c) 1=.87+ Group 2: d)r=-.874 e) r=-.964 f) r=-1.254 b) Match each group with the most plausible value for the slope, b, of its regression line! a) b = 1.94 Group 1: b) b= 491 c) b = 0- Group 2: d) b=-.494 e) b=-1.94 30- VAR00003 O 1.00 @ 2.00 1.00 -2.00 15- 1.00:1.00: R2 Linear = 0.929 2.00:2.00: R Linear = 0.768 0 O > O 0 5- 10 X7. Answer the following questions about the graph reproduced below. HOW STRONGLY YOU BELIEVE THAT YOU'LL REALLY NEVER PROCRASTINATE AGAIN HOW MUCH YOU HAVE TO DO IN THE NEXT HOUR a) Would it be appropriate to perform simple linear regression to predict how strongly a person believes that he or she will really never procrastinate again from how much that person has to do in the next hour? Explain. tt ttt b) What is the unit of analysis for this graph? That is, what does a case represent for this graph? For example, in the NELS data set, a case represents a student."
Step by Step Solution
There are 3 Steps involved in it
Step: 1
Get Instant Access to Expert-Tailored Solutions
See step-by-step solutions with expert insights and AI powered tools for academic success
Step: 2
Step: 3
Ace Your Homework with AI
Get the answers you need in no time with our AI-driven, step-by-step assistance