

Answered step by step
Verified Expert Solution
Question
1 Approved Answer
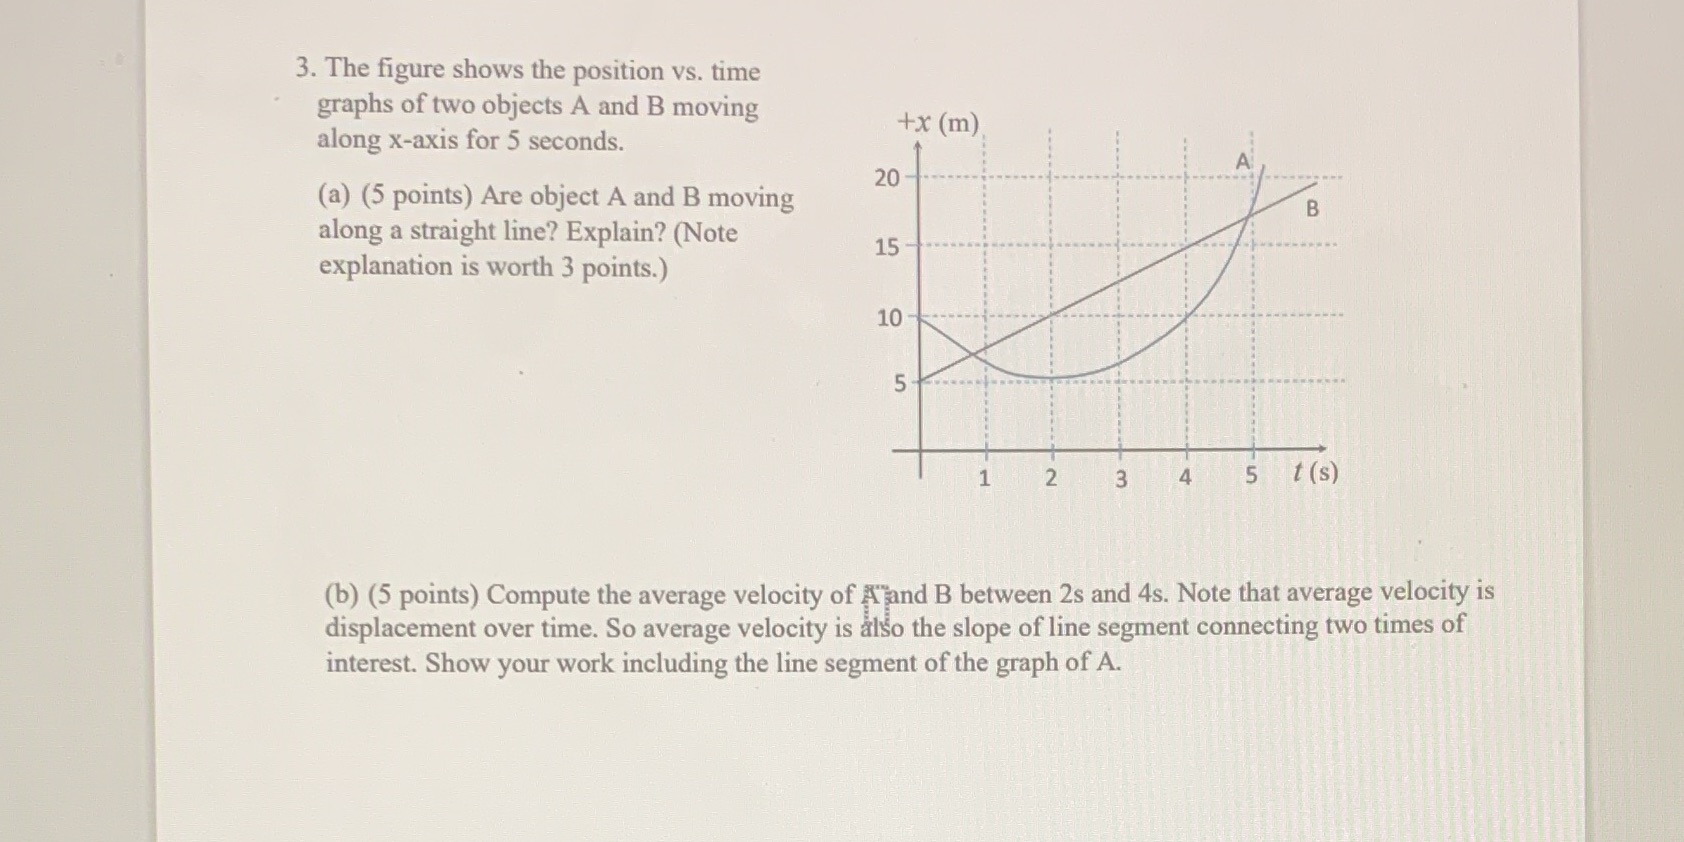
3. The figure shows the position vs. time graphs of two objects A and B moving along x-axis for 5 seconds. +x (m) 20 (a)
Step by Step Solution
There are 3 Steps involved in it
Step: 1

Get Instant Access to Expert-Tailored Solutions
See step-by-step solutions with expert insights and AI powered tools for academic success
Step: 2

Step: 3
Ace Your Homework with AI
Get the answers you need in no time with our AI-driven, step-by-step assistance
Get Started
Applied Physics
Authors: Dale ewen, Neill schurter, P. erik gundersen
10th Edition
978-0136116332, 136116337, 9780132830096, 978-0132109277