

Answered step by step
Verified Expert Solution
Question
1 Approved Answer
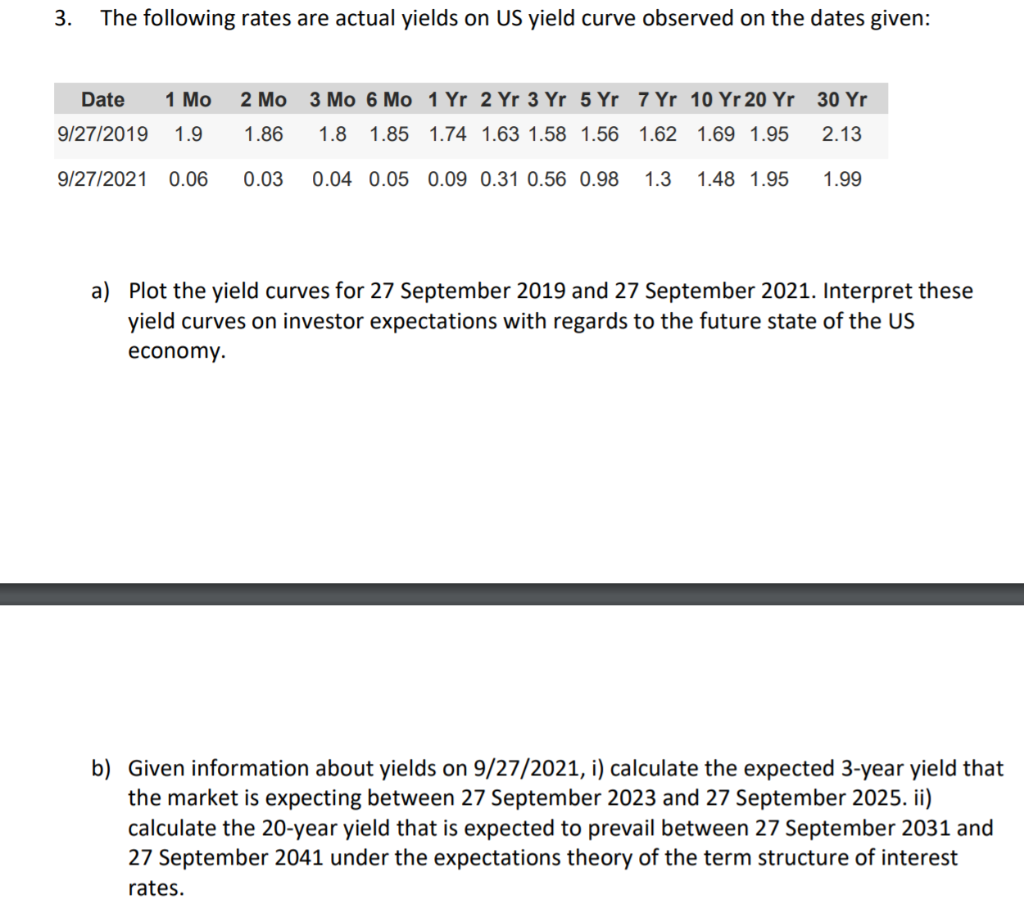
3. The following rates are actual yields on US yield curve observed on the dates given: Date 1 Mo 2 Mo 3 Mo 6 Mo
Step by Step Solution
There are 3 Steps involved in it
Step: 1

Get Instant Access to Expert-Tailored Solutions
See step-by-step solutions with expert insights and AI powered tools for academic success
Step: 2

Step: 3
Ace Your Homework with AI
Get the answers you need in no time with our AI-driven, step-by-step assistance
Get Started
Future Trading Navigating The Cryptocurrency Futures Trading Landscape Opportunities Challenges And Strategies
Authors: Yun Jin Xu
1st Edition
979-8867102340