Answered step by step
Verified Expert Solution
Link Copied!

Question

1 Approved Answer

31. The following figure shows the total cost and total revenue for a firm when it prices its products at $8 and $10. TC Price
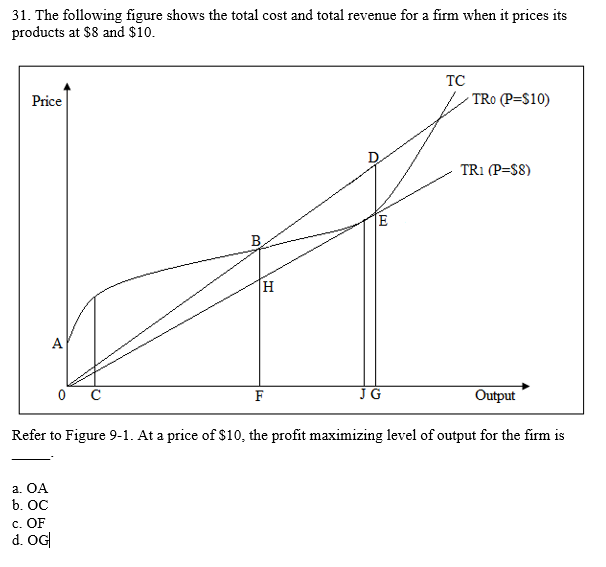
image text in transcribed

31. The following figure shows the total cost and total revenue for a firm when it prices its products at $8 and $10. TC Price TRO (P=$10) TR1 (P=$8) E . H A 0 C F JG Output Refer to Figure 9-1. At a price of $10, the profit maximizing level of output for the firm is a. OA b. OC c. OF d. OG

Step by Step Solution

There are 3 Steps involved in it

Step: 1

blur-text-image

Get Instant Access to Expert-Tailored Solutions

See step-by-step solutions with expert insights and AI powered tools for academic success

Step: 2

blur-text-image

Step: 3

blur-text-image

Ace Your Homework with AI

Get the answers you need in no time with our AI-driven, step-by-step assistance

Get Started

Recommended Textbook for

Essentials Of Applied Econometrics

Authors: Aaron D Smith, J Edward Taylor

1st Edition

0520288335, 9780520288331

More Books

Students also viewed these Economics questions

Question

12 3/4 % of what amount is $27.50?

Answered: 1 week ago