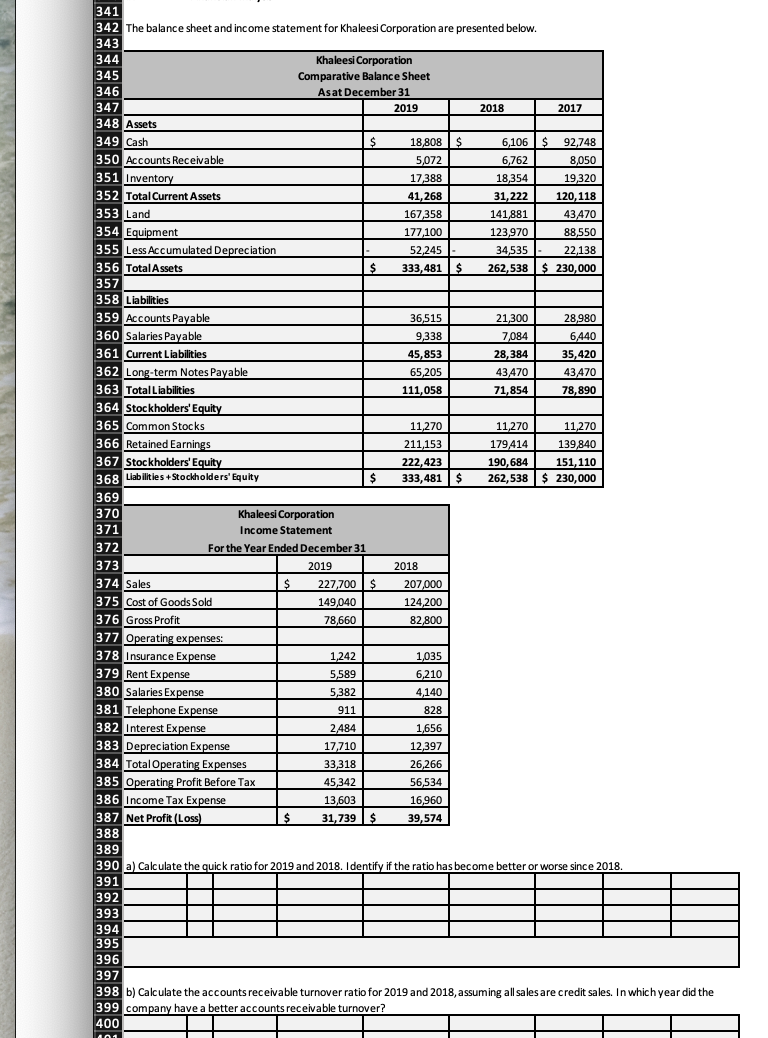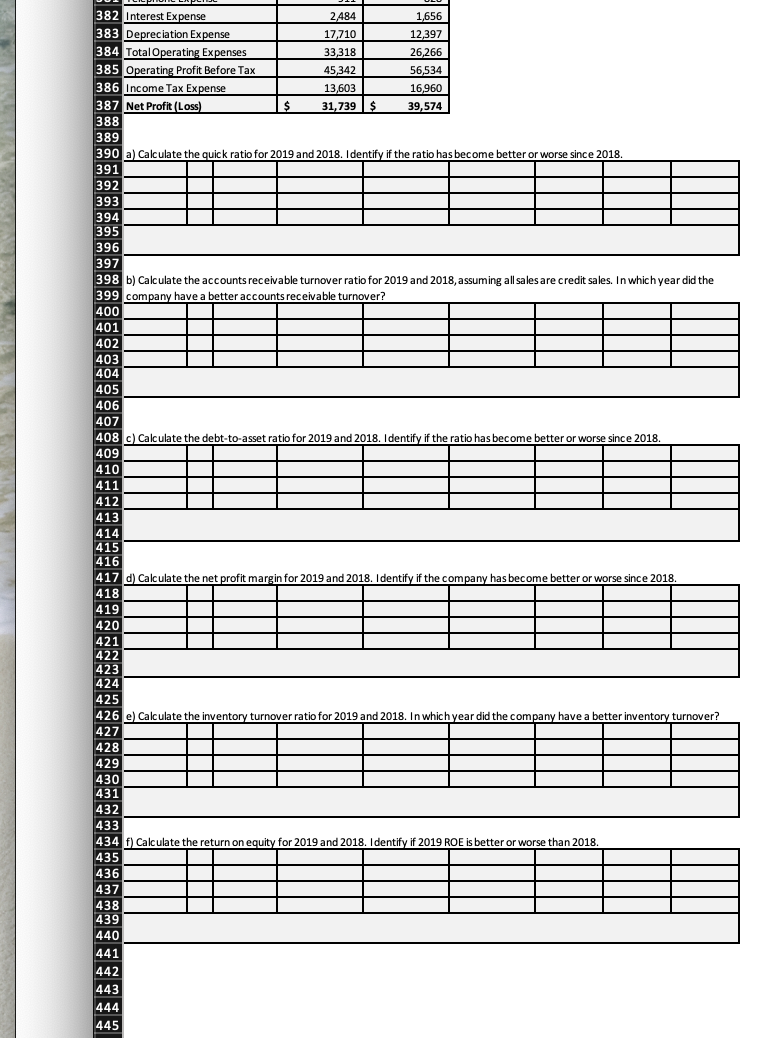

341 342 The balance sheet and income statement for Khaleesi Corporation are presented below. 343 344 Khaleesi Corporation 345 Comparative Balance Sheet 346 Asat December 31 347 | 2019 2018 2017 348 Assets 349 Cash $ 18,808 $ 6,106 $ 92,748 350 Accounts Receivable 5,072 6,762 8,050 351 Inventory 17,388 18,354 19,320 352 Total Current Assets 41,268 31,222 120, 118 353 Land 167,358 141881 43,470 354 Equipment 177,100 123,970 88,550 355 Less Accumulated Depreciation 52,245 34,535. 22,138 356 Total Assets $ 333,481 $ 262,538 $ 230,000 357 358 Liabilities 359 Accounts Payable 36,515 21,300 28,980 360 Salaries Payable 9,338 7,084 6,440 361 Current Liabilities 45,853 28,384 35,420 362 Long-term Notes Payable 65,205 43 470 43470 363 Total Liabilities 111,058 71,854 78,890 364 Stockholders' Equity 365 Common Stocks 11,270 11,270 11,270 366 Retained Earnings 211,153 179,414 139,840 367 Stockholders' Equity 222,423 190,684 151, 110 368 Liabilities +Stockholders' Equity $ 333,481 $ 262,538 $ 230,000 369 370 Khaleesi Corporation 371 Income Statement 372 For the Year Ended December 31 373 2019 2018 374 Sales $ 227,700 $ 207,000 375 Cost of Goods Sold 149,040 124,200 376 Gross Profit 78,660 82,800 377 Operating expenses: 378 Insurance Expense 1,242 1,035 379 Rent Expense 5,589 6,210 380 Salaries Expense 5,382 4,140 381 Telephone Expense 911 828 382 Interest Expense 2,484 1,656 383 Depreciation Expense 17,710 12,397 384 Total Operating Expenses 33,318 26,266 385 Operating Profit Before Tax I 45,342 56,534 386 Income Tax Expense 13,603 16,960 387 Net Profit (Loss) 31,739 $ 39,574 388 389 390 a) Calculate the quick ratio for 2019 and 2018. Identify if the ratio has become better or worse since 2018. 391 392 393 394 395 396 397 398 b) Calculate the accounts receivable turnover ratio for 2019 and 2018, assuming all sales are credit sales. In which year did the 399 company have a better accounts receivable turnover? 400 382 Interest Expense 2484 1,656 383 Depreciation Expense 17,710 12,397 384 Total Operating Expenses 33,318 26,266 385 Operating Profit Before Tax 45,342 56,534 386 Income Tax Expense 13,603 16,960 387 Net Profit (Loss) 31,739 $ 39,574 388 389 390 a) Calculate the quick ratio for 2019 and 2018. Identify if the ratio has become better or worse since 2018. 391 392 393 394 395 396 397 398 b) Calculate the accounts receivable turnover ratio for 2019 and 2018, assuming all sales are credit sales. In which year did the 399 company have a better accounts receivable turnover? 400 401 403 404 405 406 407 408 c) Calculate the debt-to-asset ratio for 2019 and 2018. Identify if the ratio has become better or worse since 2018. 409 410 411 412 413 414 415 416 417 d) Calculate the net profit margin for 2019 and 2018. Identify if the company has become better or worse since 2018 418 419 420 421 422 423 424 425 426 e) Calculate the inventory turnover ratio for 2019 and 2018. In which year did the company have a better inventory turnover? 429 430 431 432 433 434 f) Calculate the return on equity for 2019 and 2018. Identify if 2019 ROE is better or worse than 2018 435 436 437 438 439 440 441 443 444 445


