Answered step by step
Verified Expert Solution
Link Copied!

Question

1 Approved Answer

4 AD AS.jpg AS1 AS Price level AS2 Price level AS1 AD AD Real domestic output Real domestic output (A) (B) AS AS Price level
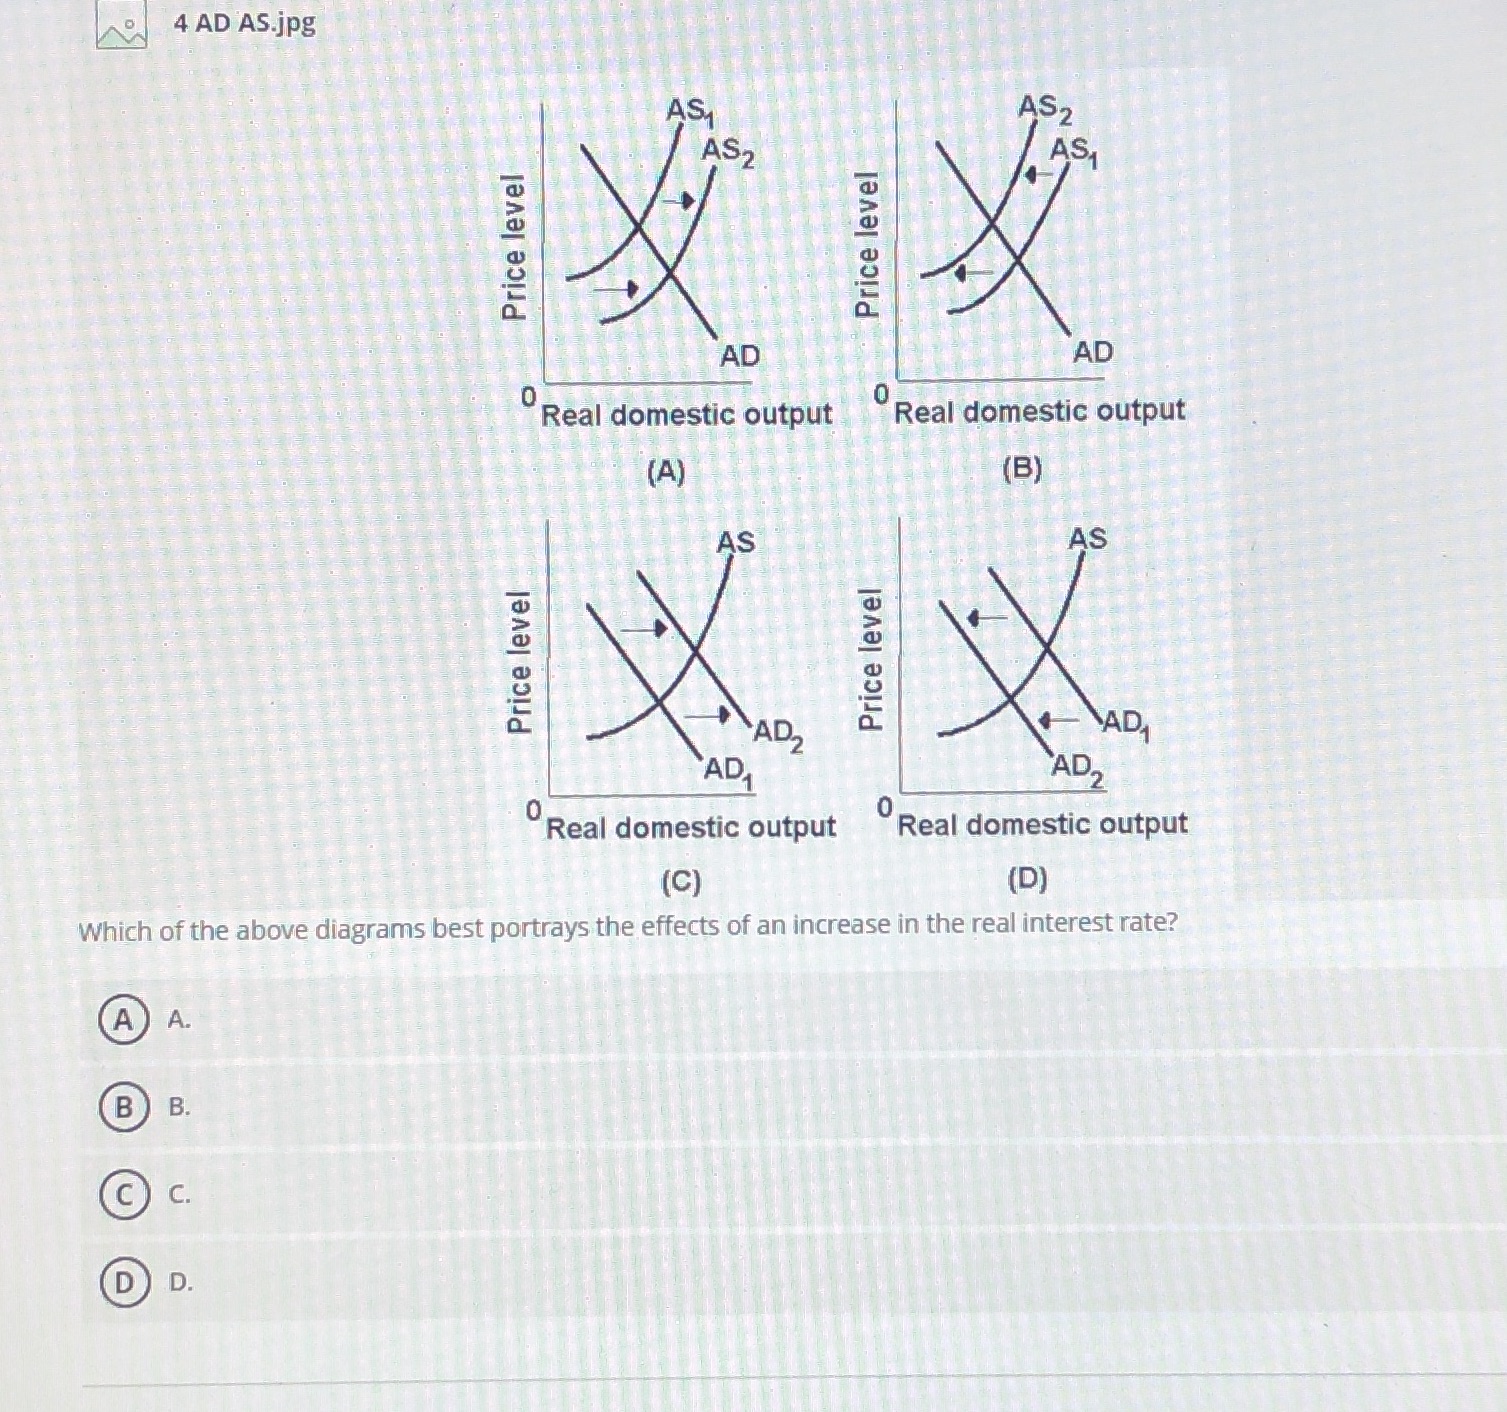
image text in transcribed
4 AD AS.jpg AS1 AS Price level AS2 Price level AS1 AD AD Real domestic output Real domestic output (A) (B) AS AS Price level AD, Real domestic output Real domestic output (C) (D) Which of the above diagrams best portrays the effects of an increase in the real interest rate? A A. B B C C. D D

Step by Step Solution

There are 3 Steps involved in it

Step: 1

blur-text-image

Get Instant Access to Expert-Tailored Solutions

See step-by-step solutions with expert insights and AI powered tools for academic success

Step: 2

blur-text-image_2

Step: 3

blur-text-image_3

Ace Your Homework with AI

Get the answers you need in no time with our AI-driven, step-by-step assistance

Get Started

Recommended Textbook for

Advanced Placement Microeconomics

Authors: Bill Hurd

1st Edition

1531150306, 978-1531150303

More Books

Students also viewed these Economics questions

Question

LO2.2 List the main characteristics of the market system.

Answered: 1 week ago

Question

LO2.5 Describe the mechanics of the circular flow model.

Answered: 1 week ago