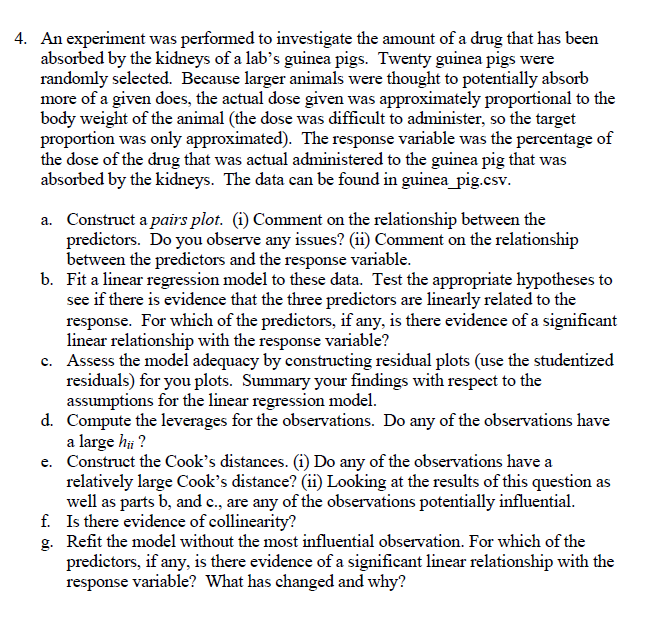
4. An experiment was performed to investigate the amount of a drug that has been absorbed by the kidneys of a lab's guinea pigs. Twenty guinea pigs were randomly selected. Because larger animals were thought to potentially absorb more of a given does, the actual dose given was approximately proportional to the body weight of the animal (the dose was difficult to administer, so the target proportion was only approximated). The response variable was the percentage of the dose of the drug that was actual administered to the guinea pig that was absorbed by the kidneys. The data can be found in guinea pig.csv. a. Construct a pairs plot. (i) Comment on the relationship between the predictors. Do you observe any issues? (ii) Comment on the relationship between the predictors and the response variable. b. Fit a linear regression model to these data. Test the appropriate hypotheses to see if there is evidence that the three predictors are linearly related to the response. For which of the predictors, if any, is there evidence of a significant linear relationship with the response variable? c. Assess the model adequacy by constructing residual plots (use the studentized residuals) for you plots. Summary your findings with respect to the assumptions for the linear regression model. d. Compute the leverages for the observations. Do any of the observations have a large hi ? e. Construct the Cook's distances. (1) Do any of the observations have a relatively large Cook's distance? (ii) Looking at the results of this question as well as parts b, and c., are any of the observations potentially influential. f. Is there evidence of collinearity? g. Refit the model without the most influential observation. For which of the predictors, if any, is there evidence of a significant linear relationship with the response variable? What has changed and why