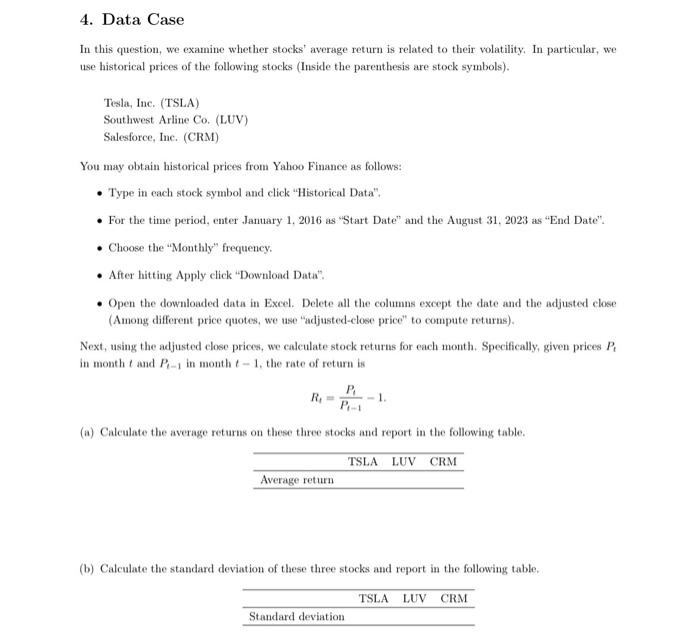
4. Data Case In this question, we examine whether stocks' average return is related to their volatility. In particular, we use historical prices of the following stocks (Inside the parenthesis are stock symbols). Tesla, lne. (TSLA) Southwest Arline Co. (LUV) Salesforce, Ine. (CRM) You may obtain historical prices from Yahoo Finance as follows: - Type in each stock symbol and click "Historical Data". - For the time period, cnter January 1, 2016 as "Start Date" and the August 31, 2023 as "End Date". - Choose the "Monthly" frequency. - After hitting Apply click "Download Data". - Open the downloaded data in Excel. Delete all the columns except the date and the adjusterd close (Among different price quotes, we use "adjusted-close price" to compute returns). Next, using the adjusted close prices, we calculate stock returns for each month. Specifically, given prices Pt in month t and Pt1 in month t1, the rate of return is Rt=Pt1P11. (a) Calculate the average returns on these three stocks and report in the following table. (b) Calculate the standard deviation of these three stocks and report in the following table. (c) Using the statistics found in (a) and (b), draw a scatter plot, where X variables are the standard deviation, and Y variables are the average return. - Hint 1. In this graph, you will see 3 dots in a simple version of the figure on Module 10, page 25, without the straight line. - Hint 2. To draw a scatter plot, please select the cells containing the standard deviation and arerage and click Insert > Charts > Scatter. (d) Do you see a clear relationship between average return and standard deviation? How would you interpret this result? 4. Data Case In this question, we examine whether stocks' average return is related to their volatility. In particular, we use historical prices of the following stocks (Inside the parenthesis are stock symbols). Tesla, lne. (TSLA) Southwest Arline Co. (LUV) Salesforce, Ine. (CRM) You may obtain historical prices from Yahoo Finance as follows: - Type in each stock symbol and click "Historical Data". - For the time period, cnter January 1, 2016 as "Start Date" and the August 31, 2023 as "End Date". - Choose the "Monthly" frequency. - After hitting Apply click "Download Data". - Open the downloaded data in Excel. Delete all the columns except the date and the adjusterd close (Among different price quotes, we use "adjusted-close price" to compute returns). Next, using the adjusted close prices, we calculate stock returns for each month. Specifically, given prices Pt in month t and Pt1 in month t1, the rate of return is Rt=Pt1P11. (a) Calculate the average returns on these three stocks and report in the following table. (b) Calculate the standard deviation of these three stocks and report in the following table. (c) Using the statistics found in (a) and (b), draw a scatter plot, where X variables are the standard deviation, and Y variables are the average return. - Hint 1. In this graph, you will see 3 dots in a simple version of the figure on Module 10, page 25, without the straight line. - Hint 2. To draw a scatter plot, please select the cells containing the standard deviation and arerage and click Insert > Charts > Scatter. (d) Do you see a clear relationship between average return and standard deviation? How would you interpret this result