

Question
4. Examine your completed worksheet and answer the following questions: a. Which inventory cost flow assumption produces the most net income? b. Which inventory cost
4. Examine your completed worksheet and answer the following questions:
a. Which inventory cost flow assumption produces the most net income?
b. Which inventory cost flow assumption produces the least net income?
c. What caused the difference between your answers to a and b?
d. Which inventory cost flow assumption produces the highest ending cash balance?
e. Which inventory cost flow assumption produces the lowest ending cash balance?
f. Does the assumption that produces the highest net income also produce the highest cash balance? Explain.
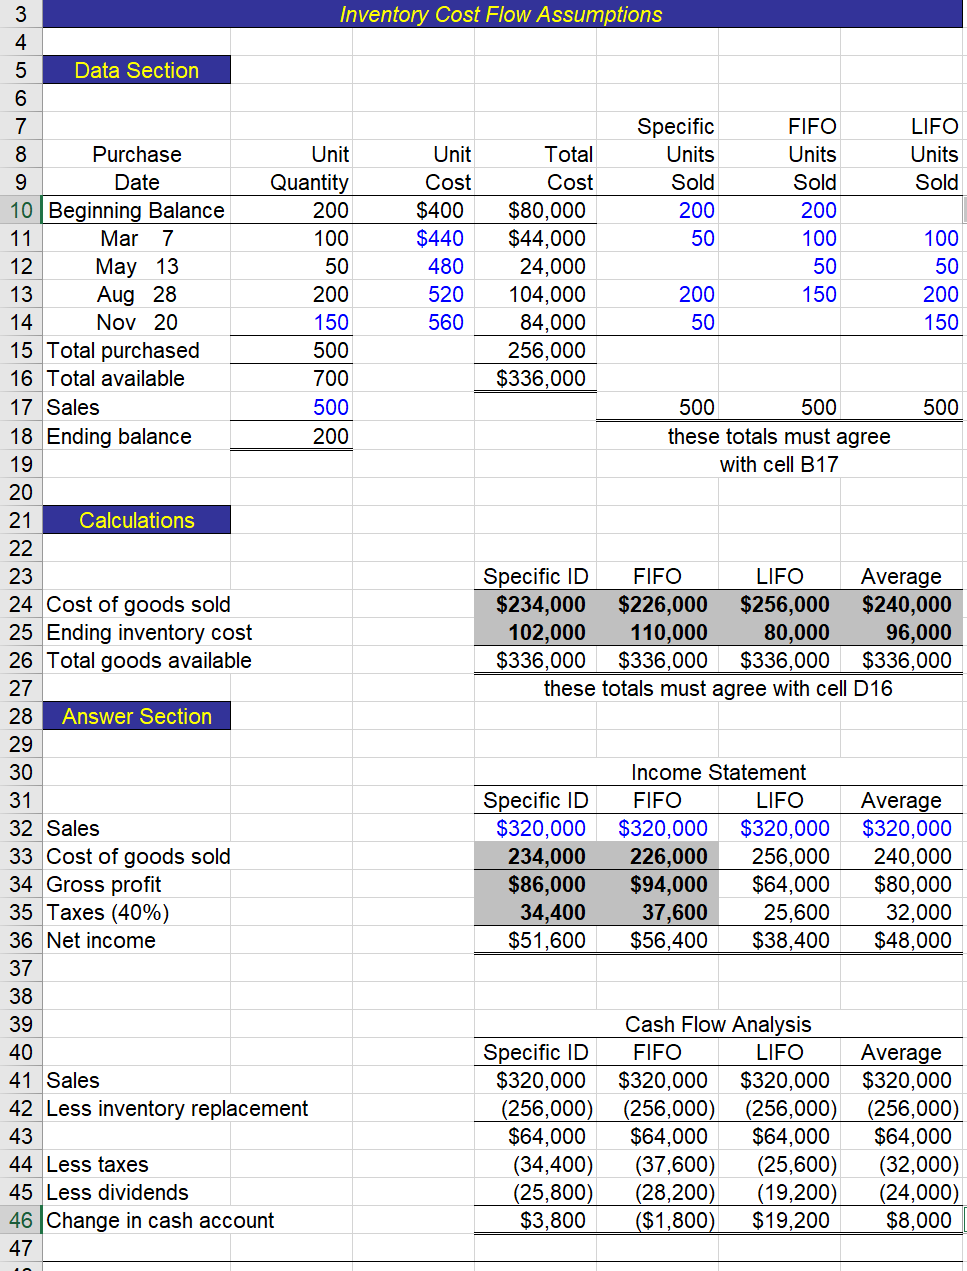
g. As you recall, Del originally used the specific identification method in his initial calculations when he projected $51,600 net income. According to Dels reckoning, that should have left him cash of $25,800 (50% of $51,600) after paying his investors. Why would he only have $3,800 left? Explain.
h. Which inventory cost flow assumption would you suggest Del use? Explain.
I. What changes would have taken place if Dels purchase prices had fallen rather than risen? To find out, enter the following values in cells C11 through C14, respectively: 390, 380, 370, and 360. Print the results. Explain what the changes are and why they have taken place.
J. Suppose Dels purchase prices had remained constant. Enter 400 in cells C11 through C14. Explain what changes take place and why.
K. Reset the purchase prices to their original values (cells C11 through C14). Suppose Del had purchased 250 units on November 20 rather than 150. Enter 250 in cell C14 and alter column G in the Data Section. Explain what happens to net income under each inventory cost flow assumption and why. Also, what management implications might this have for Del?
L. Reset the November 20 purchase to 150 units, including column G. To test your formulas, suppose that Del had sold 600 units rather than 500. Sales now total $384,000. The extra units sold come from the May 13 purchase (25 units) and the November 20 purchase (75 units). Change cell B17 to 600 and cells D32 through G32 to $384,000. Alter columns E, F, and G in the Data Section to reflect the change. Your formulas should automatically redo the Calculations and Answer sections. Print the results again. CHART ANALYSIS 9. Click the Chart sheet tab. On the screen is a column chart showing ending inventory costs. During a deflationary period, which bar represents FIFO costing, which represents LIFO costing, and which represents weighted average? Explain your reasoning.
M. Click the Chart sheet tab. On the screen is a column chart showing ending inventory costs. During a deflationary period, which bar represents FIFO costing, which represents LIFO costing, and which represents weighted average? Explain your reasoning. When the assignment is complete, close the file without saving it again.
Inventory Cost Flow Assumptions Specific Units Sold 200 50 LIFO Units Sold 3 4 5 Data Section 6 7 8 Purchase 9 Date 10 Beginning Balance 11 Mar 7 12 May 13 13 Aug 28 14 Nov 20 15 Total purchased 16 Total available 17 Sales 18 Ending balance 19 20 21 Calculations Unit Quantity 200 100 50 200 150 500 700 500 200 Unit Cost $400 $440 480 520 560 Total Cost $80,000 $44,000 24,000 104,000 84,000 256,000 $336,000 FIFO Units Sold 200 100 50 150 100 50 200 150 200 50 500 500 500 these totals must agree with cell B17 22 Specific ID FIFO LIFO Average $234,000 $226,000 $256,000 $240,000 102,000 110,000 80,000 96,000 $336,000 $336,000 $336,000 $336,000 these totals must agree with cell D16 23 24 Cost of goods sold 25 Ending inventory cost 26 Total goods available 27 28 Answer Section 29 30 31 32 Sales 33 Cost of goods sold 34 Gross profit 35 Taxes (40%) 36 Net income 37 38 39 40 41 Sales 42 Less inventory replacement 43 44 Less taxes 45 Less dividends 46 Change in cash account 47 Specific ID $320,000 234,000 $86,000 34,400 $51,600 Income Statement FIFO LIFO $320,000 $320,000 226,000 256,000 $94,000 $64,000 37,600 25,600 $56,400 $38,400 Average $320,000 240,000 $80,000 32,000 $48,000 Specific ID $320,000 (256,000) $64,000 (34,400) (25,800) $3,800 Cash Flow Analysis FIFO LIFO $320,000 $320,000 (256,000) (256,000) $64,000 $64,000 (37,600) (25,600) (28,200) (19,200) ($1,800) $19,200 Average $320,000 (256,000) $64,000 (32,000) (24,000) $8,000Step by Step Solution
There are 3 Steps involved in it
Step: 1

Get Instant Access to Expert-Tailored Solutions
See step-by-step solutions with expert insights and AI powered tools for academic success
Step: 2

Step: 3
Ace Your Homework with AI
Get the answers you need in no time with our AI-driven, step-by-step assistance
Get Started
Anti Money Laundering Audit And Controls Practical Hands On Guide For Audit And Compliance Professionals
Authors: Bob Walsh
1st Edition
1518662803, 978-1518662805