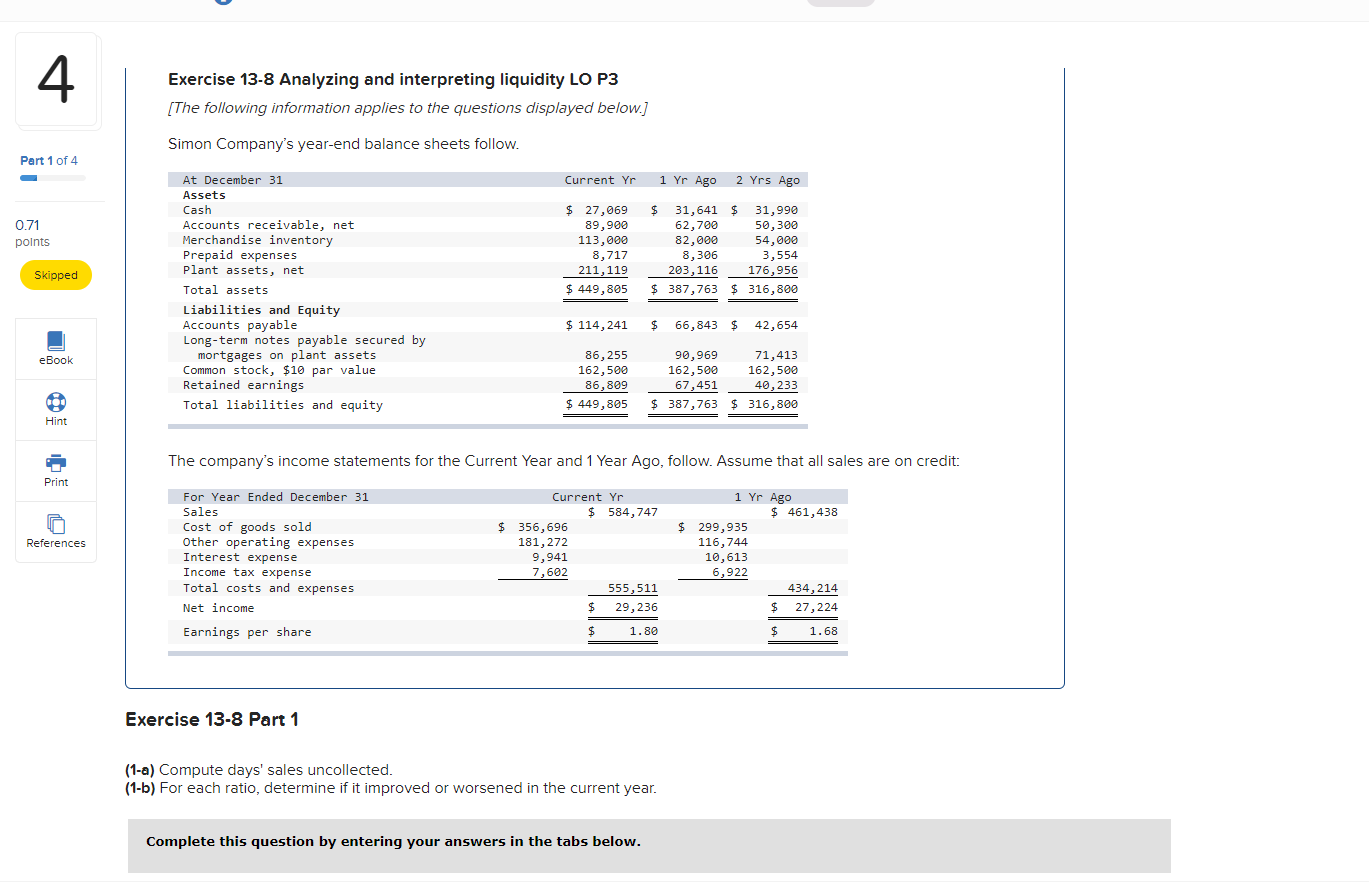
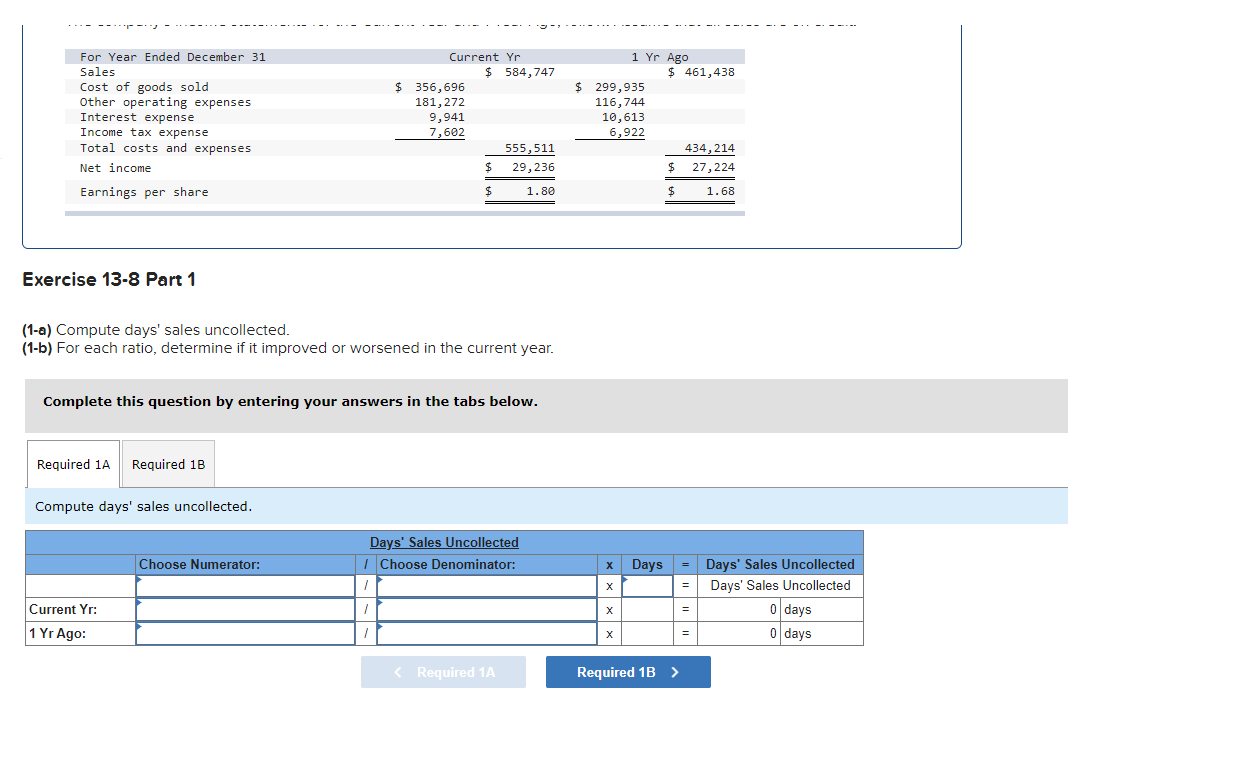
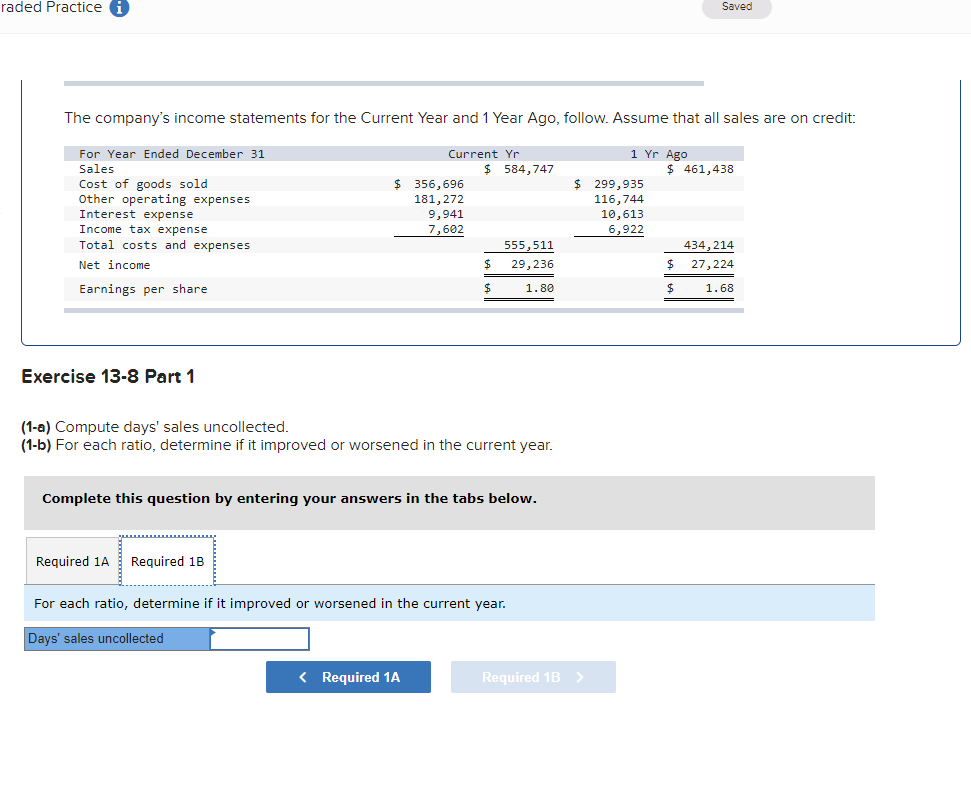
4 Exercise 13-8 Analyzing and interpreting liquidity LO P3 (The following information applies to the questions displayed below.] Simon Company's year-end balance sheets follow. Part 1 of 4 Current Yr 1 Yr Ago 2 Yrs Ago 0.71 points At December 31 Assets Cash Accounts receivable, net Merchandise inventory Prepaid expenses Plant assets, net Total assets Liabilities and Equity Accounts payable Long-term notes payable secured by mortgages on plant assets Common stock, $10 par value Retained earnings Total liabilities and equity $ 27,069 89,900 113,000 8,717 211,119 $ 449,805 $ 31,641 $ 31,990 62,700 50,300 82,000 54,000 8,306 3,554 203,116 176,956 $ 387,763 $ 316,800 Skipped $ 114,241 $ 66,843 $ 42,654 eBook 86,255 162,500 86,809 $ 449,805 90,969 71,413 162,500 162,500 67,451 40,233 $ 387,763 $ 316,800 Hint The any's income statements for the Current Year and 1 Year Ago, follow. Assume that all sales are on credit: Print References For Year Ended December 31 Sales Cost of goods sold Other operating expenses Interest expense Income tax expense Total costs and expenses Net income Earnings per share Current Yr $ 584,747 $ 356,696 181,272 9,941 7,602 555,511 $ 29,236 1 Yr Ago $ 461,438 $ 299,935 116,744 19,613 6,922 434,214 $ 27,224 $ 1.80 $ 1.68 Exercise 13-8 Part 1 (1-a) Compute days' sales uncollected. (1-b) For each ratio, determine if it improved or worsened in the current year. Complete this question by entering your answers in the tabs below. For Year Ended December 31 Sales Cost of goods sold Other operating expenses Interest expense Income tax expense Total costs and expenses Net income Earnings per share Current Yr $ 584,747 $ 356,696 181,272 9,941 7,602 555,511 $ 29,236 1 Yr Ago $ 461,438 $ 299,935 116,744 10,613 6,922 434,214 $ 27,224 $ 1.80 $ 1.68 Exercise 13-8 Part 1 (1-a) Compute days' sales uncollected. (1-b) For each ratio, determine if it improved or worsened in the current year. Complete this question by entering your answers in the tabs below. Required 1A Required 1B Compute days' sales uncollected. Days' Sales Uncollected 1 Choose Denominator: Choose Numerator: Days Days' Sales Uncollected Days' Sales Uncollected 0 days 0 days 1 X Current Yr: 1 Yr Ago: X = raded Practice i Saved The company's income statements for the Current Year and 1 Year Ago, follow. Assume that all sales are on credit: For Year Ended December 31 Sales Cost of goods sold Other operating expenses Interest expense Income tax expense Total costs and expenses Net income Earnings per share Current Yr $ 584,747 $ 356,696 181,272 9,941 7,602 555,511 $ 29,236 $ 1.80 1 Yr Ago $ 461,438 $ 299,935 116,744 10,613 6,922 434,214 $ 27,224 $ 1.68 Exercise 13-8 Part 1 (1-a) Compute days' sales uncollected. (1-b) For each ratio, determine if it improved or worsened in the current year. Complete this question by entering your answers in the tabs below. Required 1A Required 1B For each ratio, determine if it improved or worsened in the current year. Days' sales uncollected