4. Please analyse the net profit margin of Apple and BP according to the tables on the next page, then comment on why Apples net profit margin of 26% is higher compared to BPs net profit margin of 4.6%. (see the attachments)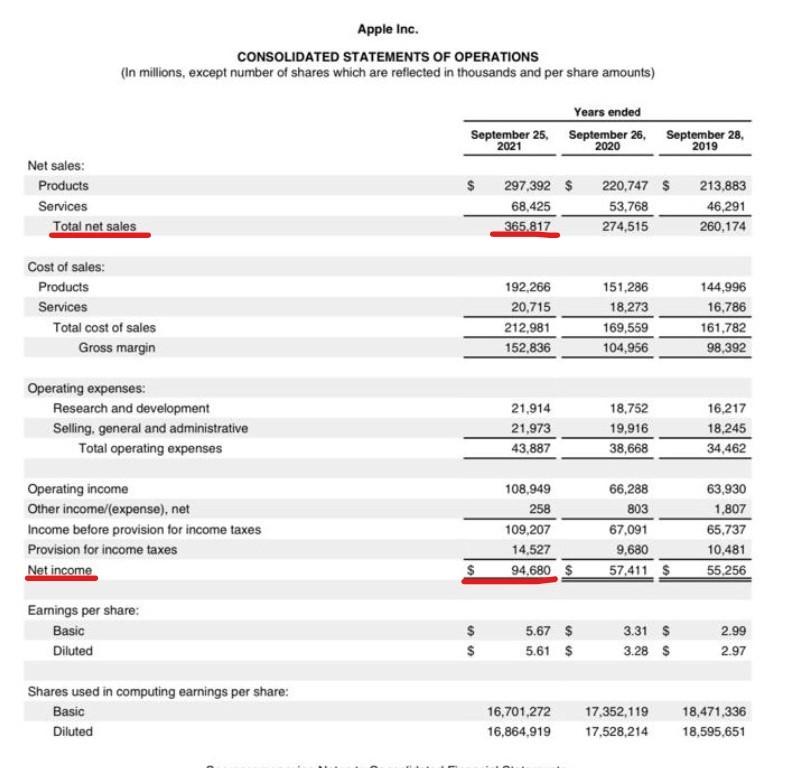
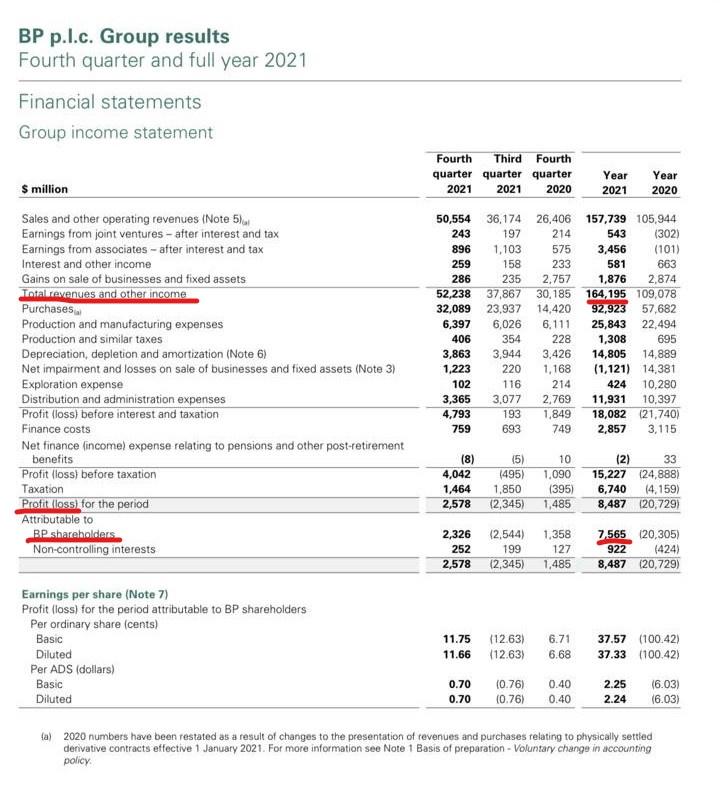
Apple Inc. CONSOLIDATED STATEMENTS OF OPERATIONS (In millions, except number of shares which are reflected in thousands and per share amounts) Years ended September 25, September 26, September 28, 2021 2020 2019 $ Net sales: Products Services Total net sales 297,392 $ 68,425 365.817 220,747 $ 53,768 274,515 213,883 46,291 260,174 Cost of sales: Products Services Total cost of sales Gross margin 192,266 20,715 212,981 152,836 151,286 18,273 169,559 104,956 144,996 16,786 161,782 98,392 Operating expenses: Research and development Selling, general and administrative Total operating expenses 21.914 21,973 43,887 18.752 19,916 38,668 16.217 18.245 34,462 Operating income Other income/(expense), net Income before provision for income taxes Provision for income taxes Net income 108,949 258 109,207 14,527 94,680 $ 66,288 803 67,091 9,680 57,411 $ 63,930 1,807 65.737 10,481 55,256 $ Earnings per share: Basic Diluted $ $ 5.67 $ 5.61 $ 3.31 $ 3.28 $ 2.99 2.97 Shares used in computing earnings per share: Basic Diluted 16,701,272 16,864,919 17,352,119 17,528,214 18,471,336 18,595,651 BP p.I.c. Group results Fourth quarter and full year 2021 Financial statements Group income statement Fourth Third Fourth quarter quarter quarter 2021 2021 2020 S million Year 2021 Year 2020 235 Sales and other operating revenues (Note 5). Earnings from joint ventures - after interest and tax Earnings from associates after interest and tax Interest and other income Gains on sale of businesses and fixed assets Total revenues and other income Purchases. Production and manufacturing expenses Production and similar taxes Depreciation, depletion and amortization (Note 6) Net impairment and losses on sale of businesses and fixed assets (Note 3) Exploration expense Distribution and administration expenses Profit (loss) before interest and taxation Finance costs Net finance (income) expense relating to pensions and other post-retirement benefits Profit (loss) before taxation Taxation Profit loss for the period Attributable to BP.shareholders Non-controlling interests 50,554 243 896 259 286 52,238 32,089 6,397 406 3,863 1,223 102 3,365 4,793 759 36,174 26,406 157,739 105,944 197 214 543 (302) 1,103 575 3,456 (101) 158 233 581 663 2,757 1,876 2,874 37,867 30.185 164,195 109,078 23.937 14,420 92,923 57,682 6,026 6,111 25,843 22,494 354 228 1,308 695 3,944 3,426 14,805 14,889 220 1,168 (1,121) 14.381 116 214 424 10,280 3,077 2,769 11,931 10,397 193 1,849 18,082 21.740) 693 749 2,857 3,115 (8) 4,042 1,464 2,578 (5) (495) 1,850 (2,345) 10 1.090 (395) 1,485 (2) 33 15,227 (24,888) 6,740 14,159) 8,487 (20,729) 2,326 252 2,578 (2,544) 199 (2,345) 1.358 127 1,485 7,565 20,305) (424) 8,487 (20,729) 922 Earnings per share (Note 7) Profit (loss) for the period attributable to BP shareholders Per ordinary share (cents) Basic Diluted Per ADS (dollars) Basic Diluted 11.75 11.66 (12.63) (12.63) 6.71 6.68 37.57 (100.42) 37.33 (100.42) 0.70 0.70 (0.76) (0.76) 0.40 0.40 2.25 2.24 (6.03) (6.03) {a) 2020 numbers have been restated as a result of changes to the presentation of revenues and purchases relating to physically settled derivative contracts effective 1 January 2021. For more information see Note 1 Basis of preparation - Voluntary change in accounting policy Apple Inc. CONSOLIDATED STATEMENTS OF OPERATIONS (In millions, except number of shares which are reflected in thousands and per share amounts) Years ended September 25, September 26, September 28, 2021 2020 2019 $ Net sales: Products Services Total net sales 297,392 $ 68,425 365.817 220,747 $ 53,768 274,515 213,883 46,291 260,174 Cost of sales: Products Services Total cost of sales Gross margin 192,266 20,715 212,981 152,836 151,286 18,273 169,559 104,956 144,996 16,786 161,782 98,392 Operating expenses: Research and development Selling, general and administrative Total operating expenses 21.914 21,973 43,887 18.752 19,916 38,668 16.217 18.245 34,462 Operating income Other income/(expense), net Income before provision for income taxes Provision for income taxes Net income 108,949 258 109,207 14,527 94,680 $ 66,288 803 67,091 9,680 57,411 $ 63,930 1,807 65.737 10,481 55,256 $ Earnings per share: Basic Diluted $ $ 5.67 $ 5.61 $ 3.31 $ 3.28 $ 2.99 2.97 Shares used in computing earnings per share: Basic Diluted 16,701,272 16,864,919 17,352,119 17,528,214 18,471,336 18,595,651 BP p.I.c. Group results Fourth quarter and full year 2021 Financial statements Group income statement Fourth Third Fourth quarter quarter quarter 2021 2021 2020 S million Year 2021 Year 2020 235 Sales and other operating revenues (Note 5). Earnings from joint ventures - after interest and tax Earnings from associates after interest and tax Interest and other income Gains on sale of businesses and fixed assets Total revenues and other income Purchases. Production and manufacturing expenses Production and similar taxes Depreciation, depletion and amortization (Note 6) Net impairment and losses on sale of businesses and fixed assets (Note 3) Exploration expense Distribution and administration expenses Profit (loss) before interest and taxation Finance costs Net finance (income) expense relating to pensions and other post-retirement benefits Profit (loss) before taxation Taxation Profit loss for the period Attributable to BP.shareholders Non-controlling interests 50,554 243 896 259 286 52,238 32,089 6,397 406 3,863 1,223 102 3,365 4,793 759 36,174 26,406 157,739 105,944 197 214 543 (302) 1,103 575 3,456 (101) 158 233 581 663 2,757 1,876 2,874 37,867 30.185 164,195 109,078 23.937 14,420 92,923 57,682 6,026 6,111 25,843 22,494 354 228 1,308 695 3,944 3,426 14,805 14,889 220 1,168 (1,121) 14.381 116 214 424 10,280 3,077 2,769 11,931 10,397 193 1,849 18,082 21.740) 693 749 2,857 3,115 (8) 4,042 1,464 2,578 (5) (495) 1,850 (2,345) 10 1.090 (395) 1,485 (2) 33 15,227 (24,888) 6,740 14,159) 8,487 (20,729) 2,326 252 2,578 (2,544) 199 (2,345) 1.358 127 1,485 7,565 20,305) (424) 8,487 (20,729) 922 Earnings per share (Note 7) Profit (loss) for the period attributable to BP shareholders Per ordinary share (cents) Basic Diluted Per ADS (dollars) Basic Diluted 11.75 11.66 (12.63) (12.63) 6.71 6.68 37.57 (100.42) 37.33 (100.42) 0.70 0.70 (0.76) (0.76) 0.40 0.40 2.25 2.24 (6.03) (6.03) {a) 2020 numbers have been restated as a result of changes to the presentation of revenues and purchases relating to physically settled derivative contracts effective 1 January 2021. For more information see Note 1 Basis of preparation - Voluntary change in accounting policy


