Answered step by step
Verified Expert Solution
Link Copied!

Question

1 Approved Answer

- - 4. Suppose a company has employee annual salary data as follows. For the interval $$ 1$ to $$ 25,000,5$ employees; for the interval
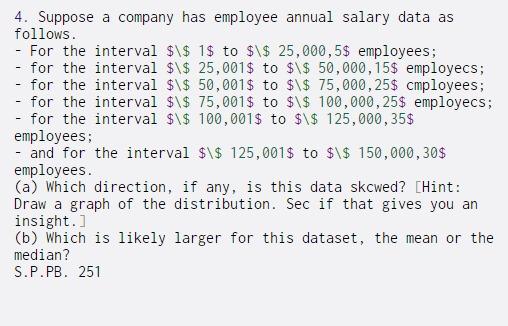
image text in transcribed

- - 4. Suppose a company has employee annual salary data as follows. For the interval $\$ 1$ to $\$ 25,000,5$ employees; for the interval $\$ 25,001$ to $\$ 50,000,15$ employecs; for the interval $\$ 50,001$ to $\$ 75,000,25$ cmployees; - for the interval $\$ 75,001$ to $\$ 100,000,25$ employecs; - for the interval $\$ 100,001$ to $\$ 125,000,35$ employees; - and for the interval $\$ 125,001$ to $\$ 150,000,30$ employees. (a) Which direction, if any, is this data skcwed? (Hint: Draw a graph of the distribution. Sec if that gives you an insight.] (b) Which is likely larger for this dataset, the mean or the median? S.P.PB. 251

Step by Step Solution

There are 3 Steps involved in it

Step: 1

blur-text-image

Get Instant Access to Expert-Tailored Solutions

See step-by-step solutions with expert insights and AI powered tools for academic success

Step: 2

blur-text-image

Step: 3

blur-text-image

Ace Your Homework with AI

Get the answers you need in no time with our AI-driven, step-by-step assistance

Get Started

Recommended Textbook for

The Database Management Systems

Authors: Patricia Ward, George A Dafoulas

1st Edition

ISBN: 1844804526, 978-1844804528

More Books

Students also viewed these Databases questions

Question

What is the sales mix variance, and is it controllable by managers?

Answered: 1 week ago