Answered step by step
Verified Expert Solution
Link Copied!

Question

1 Approved Answer

............. 4. Suppose that the market for a product is in a monopoly. Using the following table graph the necessary curve. I suggest using desmos

.............
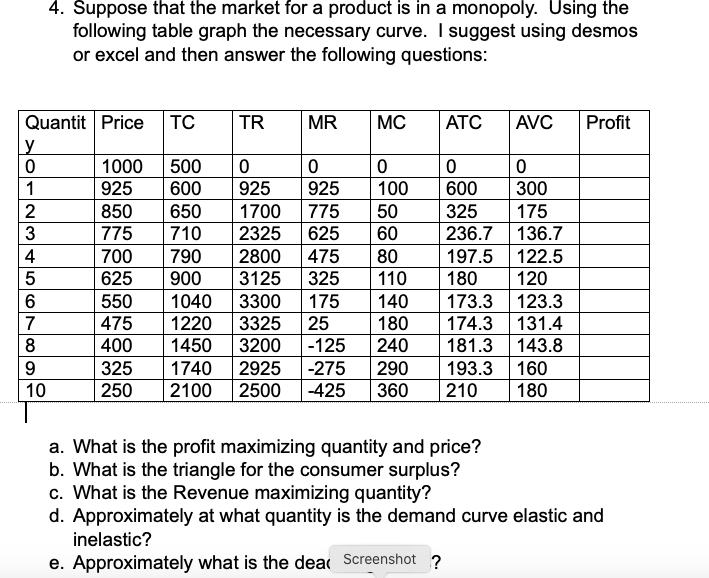
image text in transcribed
4. Suppose that the market for a product is in a monopoly. Using the following table graph the necessary curve. I suggest using desmos or excel and then answer the following questions: Quantit | Price TC TR MR MC ATC AVC Profit y 0 1000 500 0 0 0 0 0 925 600 925 925 100 600 300 2 850 650 1700 775 50 325 175 3 775 710 2325 625 60 236.7 136.7 4 700 790 2800 475 80 197.5 122.5 5 625 900 3125 325 110 180 120 6 550 1040 3300 175 140 173.3 123.3 7 475 1220 3325 25 180 174.3 131.4 8 400 1450 3200 -125 240 181.3 143.8 9 325 1740 2925 -275 290 193.3 160 10 250 2100 2500 -425 360 210 180 a. What is the profit maximizing quantity and price? b. What is the triangle for the consumer surplus? c. What is the Revenue maximizing quantity? d. Approximately at what quantity is the demand curve elastic and inelastic? e. Approximately what is the dear Screenshot

Step by Step Solution

There are 3 Steps involved in it

Step: 1

blur-text-image

Get Instant Access to Expert-Tailored Solutions

See step-by-step solutions with expert insights and AI powered tools for academic success

Step: 2

blur-text-image

Step: 3

blur-text-image

Ace Your Homework with AI

Get the answers you need in no time with our AI-driven, step-by-step assistance

Get Started

Recommended Textbook for

Econometric Analysis

Authors: William H. Greene

5th Edition

130661899, 978-0130661890

More Books

Students also viewed these Economics questions

Question

2. Define the nominal exchange rate and the real exchange rate.

Answered: 1 week ago

Question

LO13.1 List the characteristics of monopolistic competition.

Answered: 1 week ago