

Answered step by step
Verified Expert Solution
Question
1 Approved Answer
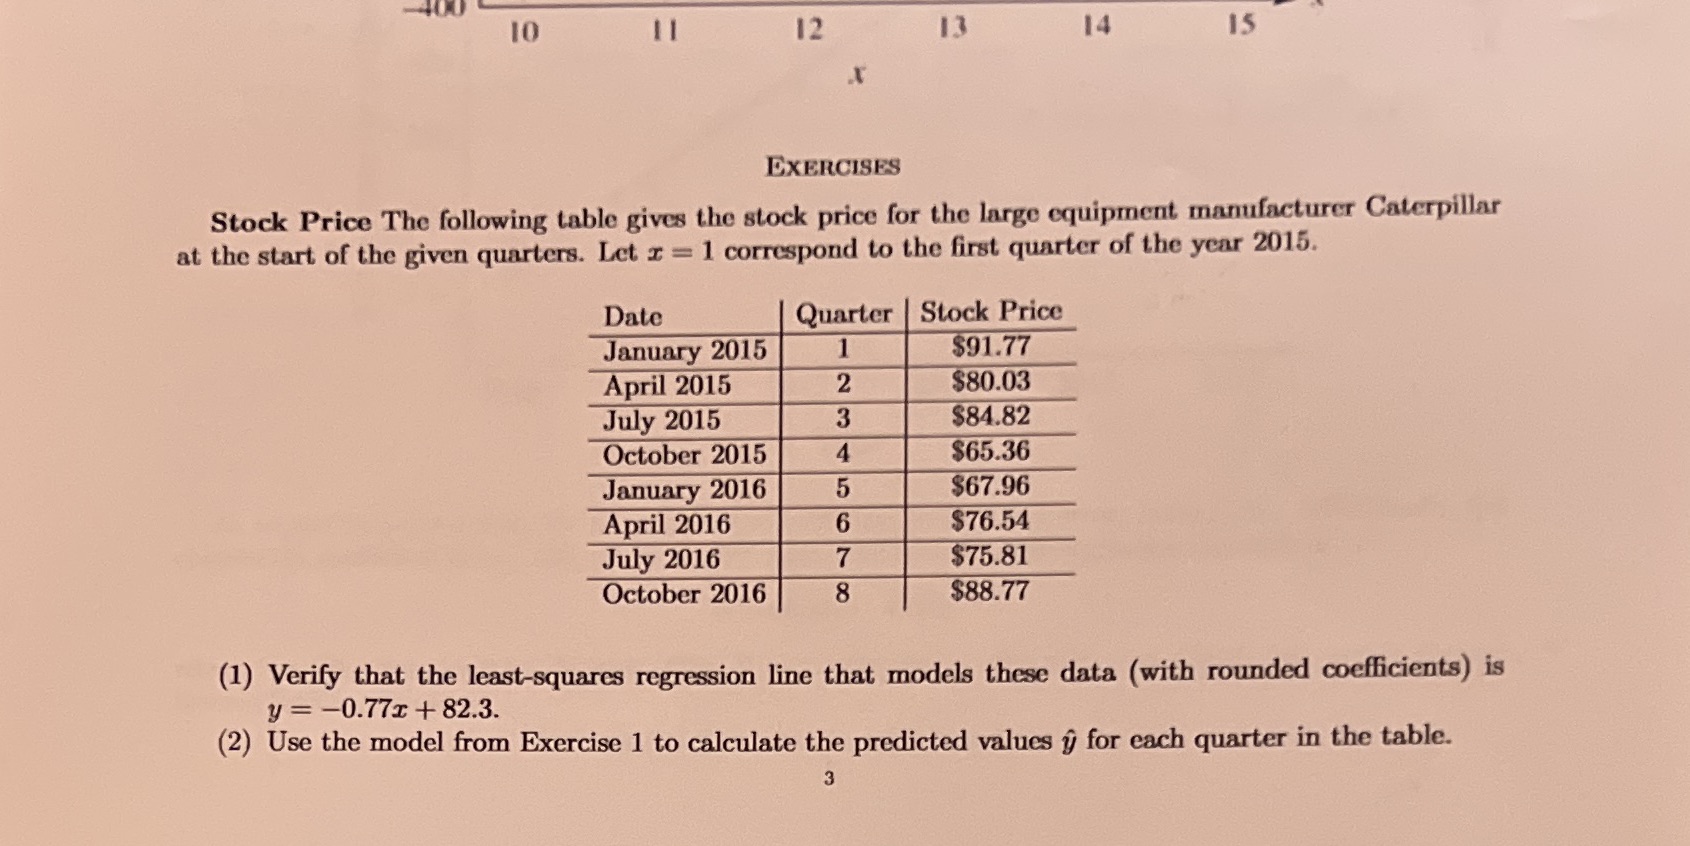
400 10 11 12 13 14 15 EXERCISES Stock Price The following table gives the stock price for the large equipment manufacturer Caterpillar at the
Step by Step Solution
There are 3 Steps involved in it
Step: 1

Get Instant Access to Expert-Tailored Solutions
See step-by-step solutions with expert insights and AI powered tools for academic success
Step: 2

Step: 3
Ace Your Homework with AI
Get the answers you need in no time with our AI-driven, step-by-step assistance
Get Started
Finite Mathematics and Its Applications
Authors: Larry J. Goldstein, David I. Schneider, Martha J. Siegel, Steven Hair
12th edition
978-0134768588, 9780134437767, 134768582, 134437764, 978-0134768632