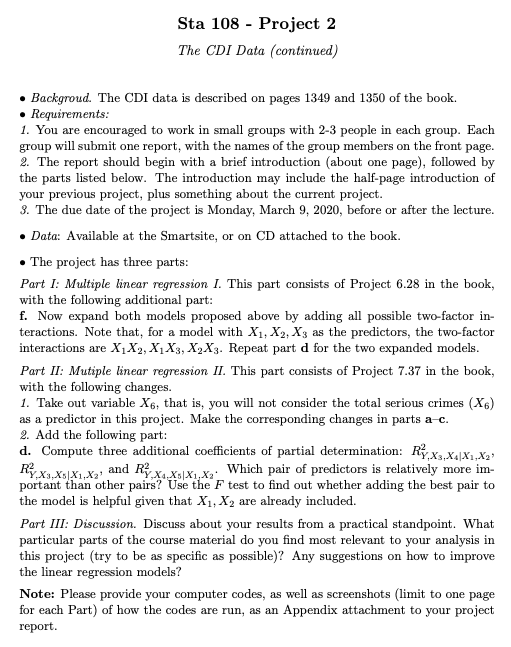
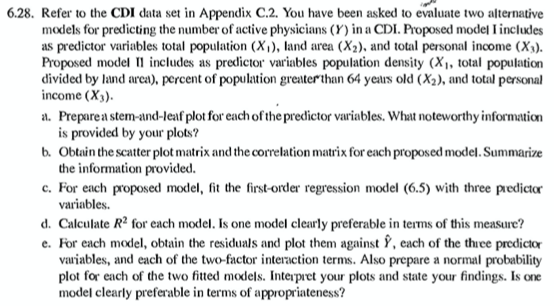
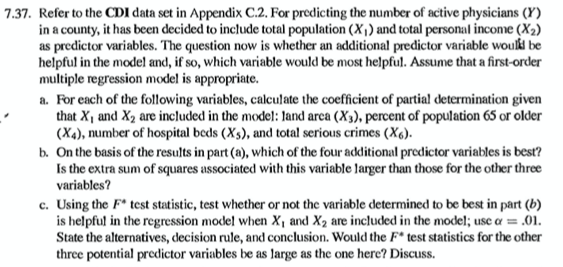
Sta 108 - Project 2 The CDI Data (continued) . BackgroudonI data is described on pages 1349 and 1350 of the book. . Requirements: 1. You are encouraged to work in small groups with 2-3 people in each group. Each group will submit one report, with the names of the group members on the front page. 2. The report should begin with a brief introduction (about one page), followed by the parts listed below. The introduction may include the half-page introduction of your previous project, plus something about the current project. 3. The due date of the project is Monday, March 9, 2020, before or after the lecture. . Data: Available at the Smartsite, or on CD attached to the book. . The project has three parts: Part I: Multiple linear regression I. This part consists of Project 6.28 in the book, with the following additional part: f. Now expand both models proposed above by adding all possible two-factor in- teractions. Note that, for a model with X1, X2, Xs as the predictors, the two-factor interactions are X1X2, X1Xs, X2 Xs. Repeat part d for the two expanded models. Part II: Mutiple linear regression II. This part consists of Project 7.37 in the book, with the following changes. 1. Take out variable X's, that is, you will not consider the total serious crimes (X6) as a predictor in this project. Make the corresponding changes in parts a c. 2. Add the following part: d. Compute three additional coefficients of partial determination: RyxxXX; Yxxxx, and RYx x x1,x. Which pair of predictors is relatively more im- portant than other pairs? Use the F test to find out whether adding the best pair to the model is helpful given that X1, Xy are already included. Part III: Discussion. Discuss about your results from a practical standpoint. What particular parts of the course material do you find most relevant to your analysis in this project (try to be as specific as possible)? Any suggestions on how to improve the linear regression models? Note: Please provide your computer codes, as well as screenshots (limit to one page for each Part) of how the codes are run, as an Appendix attachment to your project report.6.28. Refer to the CDI data set in Appendix C.2. You have been asked to evaluate two alternative models for predicting the number of active physicians (1) in a CDI. Proposed model I includes as predictor variables total population (X,), land area (X2), and total personal income (X,). Proposed model II includes as predictor variables population density (X1, total population divided by land area), percent of population greater than 64 years old (X2), and total personal income (X3). a. Preparea stem-and-leaf plot for each of the predictor variables. What noteworthy information is provided by your plots? b. Obtain the scatter plot matrix and the correlation matrix for each proposed model. Summarize the information provided. c. For each proposed model, fit the first-order regression model (6.5) with three predictor variables. d. Calculate R2 for each model. Is one model clearly preferable in terms of this measure? e. For each model, obtain the residuals and plot them against ), each of the three predictor variables, and each of the two-factor interaction terms. Also prepare a normal probability plot for each of the two fitted models. Interpret your plots and state your findings. Is one model clearly preferable in terms of appropriateness?7.37. Refer to the CDI data set in Appendix C.2. For predicting the number of active physicians (1) in a county, it has been decided to include total population (X,) and total personal income (X2) as predictor variables. The question now is whether an additional predictor variable would be helpful in the model and, if so, which variable would be most helpful. Assume that a first-order multiple regression model is appropriate. a. For each of the following variables, calculate the coefficient of partial determination given that X, and X2 are included in the model: land area (X3), percent of population 65 or older (X4), number of hospital beds (Xs), and total serious crimes (X6). b. On the basis of the results in part (a), which of the four additional predictor variables is best? Is the extra sum of squares associated with this variable larger than those for the other three variables? c. Using the F* test statistic, test whether or not the variable determined to be best in part (b) is helpful in the regression model when X, and X2 are included in the model; use a = .01. State the alternatives, decision rule, and conclusion. Would the F* test statistics for the other three potential predictor variables be as large as the one here? Discuss


