

Answered step by step
Verified Expert Solution
Question
1 Approved Answer
4.1 Create a PivotTable on the Speeders worksheet. a. Show the 5 worst states for fatal collisions involving speeding. b. Sort the PivotTable values from
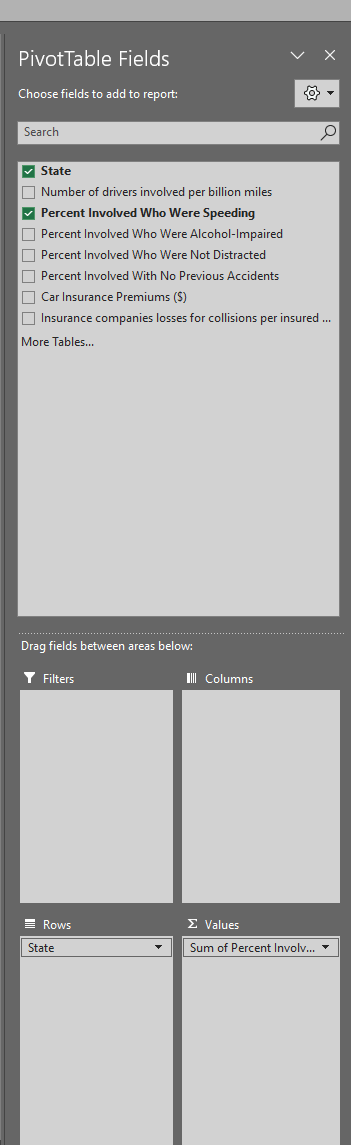
4.1 Create a PivotTable on the Speeders worksheet.
a. Show the 5 worst states for fatal collisions involving speeding.
b. Sort the PivotTable values from largest to smallest.
How do I do steps A and B?
State Number of drivers involved per billion miles Percent Involved Who Were Speeding Percent Involved Who Were Alcohol-Impaired Percent Involved Who Were Not Distracted Percent Involved With No Previous Accidents Car Insurance Premiums ( $ ) Insurance companies losses for collisions per insured ... More TablesStep by Step Solution
There are 3 Steps involved in it
Step: 1

Get Instant Access to Expert-Tailored Solutions
See step-by-step solutions with expert insights and AI powered tools for academic success
Step: 2

Step: 3
Ace Your Homework with AI
Get the answers you need in no time with our AI-driven, step-by-step assistance
Get Started
Object Oriented Databases Prentice Hall International Series In Computer Science
Authors: John G. Hughes
1st Edition
0136298745, 978-0136298748