Answered step by step
Verified Expert Solution
Link Copied!

Question

1 Approved Answer

45. What type of graph is this? a. Histogram b. Scatter diagram c. Frequency curve d. Time-series 46. Which variable is on the ( y
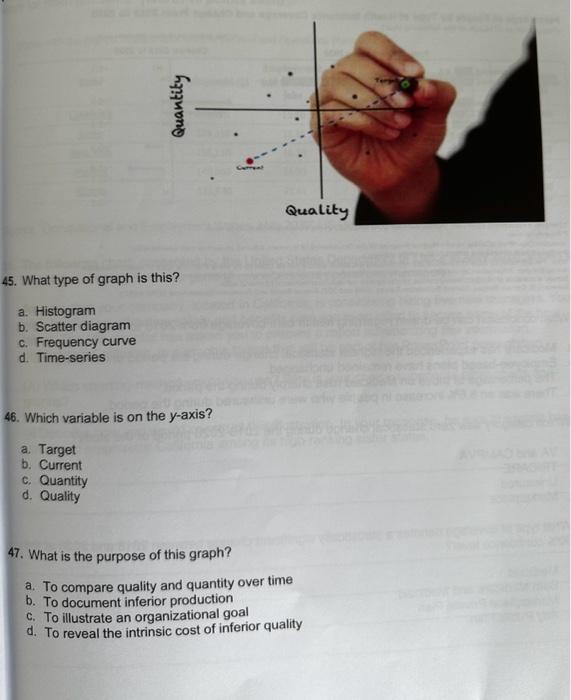
image text in transcribed
45. What type of graph is this? a. Histogram b. Scatter diagram c. Frequency curve d. Time-series 46. Which variable is on the \\( y \\)-axis? a. Target b. Current c. Quantity d. Quality 47. What is the purpose of this graph? a. To compare quality and quantity over time b. To document inferior production c. To illustrate an organizational goal d. To reveal the intrinsic cost of inferior quality

Step by Step Solution

There are 3 Steps involved in it

Step: 1

blur-text-image

Get Instant Access to Expert-Tailored Solutions

See step-by-step solutions with expert insights and AI powered tools for academic success

Step: 2

blur-text-image_2

Step: 3

blur-text-image_3

Ace Your Homework with AI

Get the answers you need in no time with our AI-driven, step-by-step assistance

Get Started

Recommended Textbook for

Successful Project Management

Authors: Jack Gido, Jim Clements

4th Edition

9780324656152, 324656130, 978-0324656138

More Books

Students also viewed these General Management questions