4:58 > Identify the industry based on financial V statement analysis ED Q 1 of 5 + > > THUNDERBIRD SCHOOL OF GLOBAL MANAGEMENT TB0385
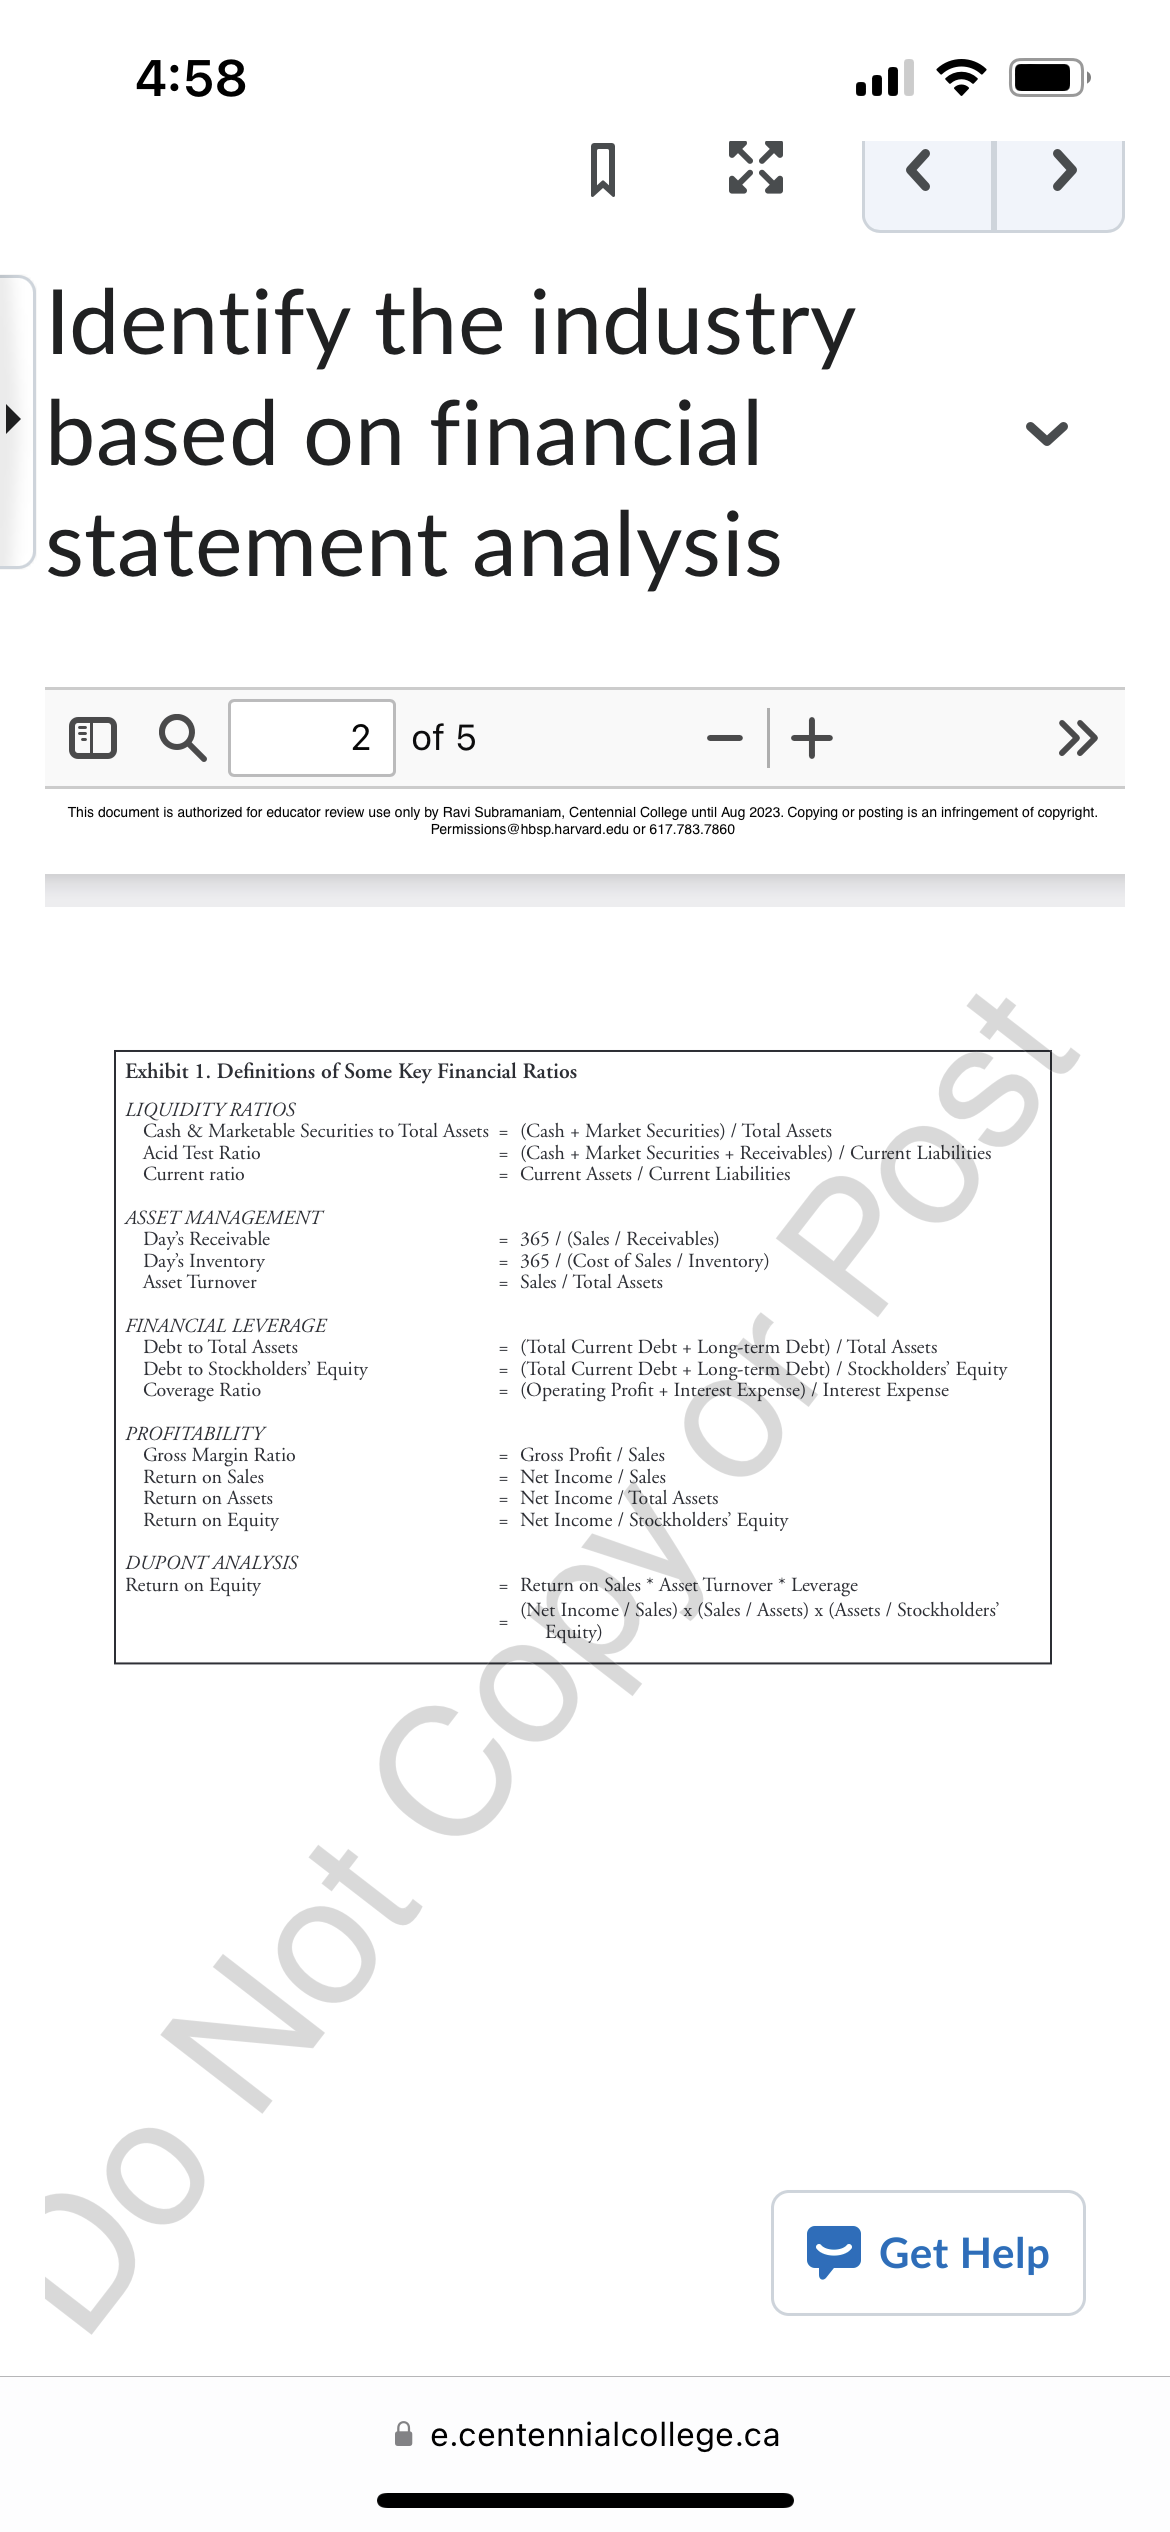
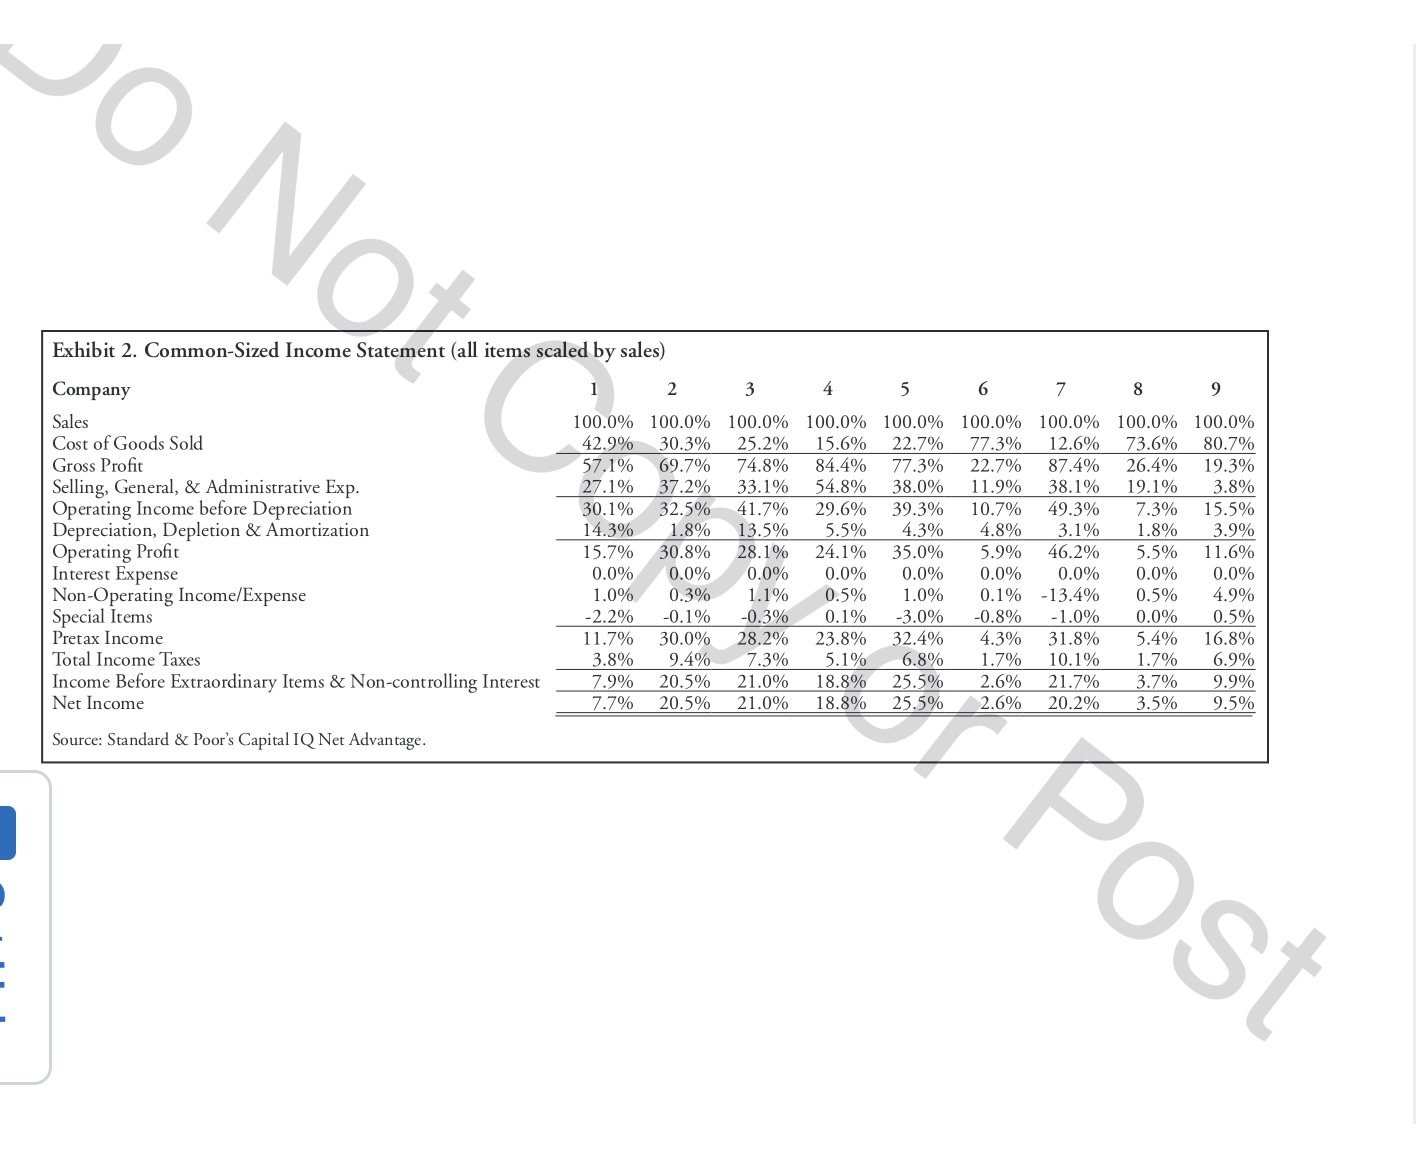
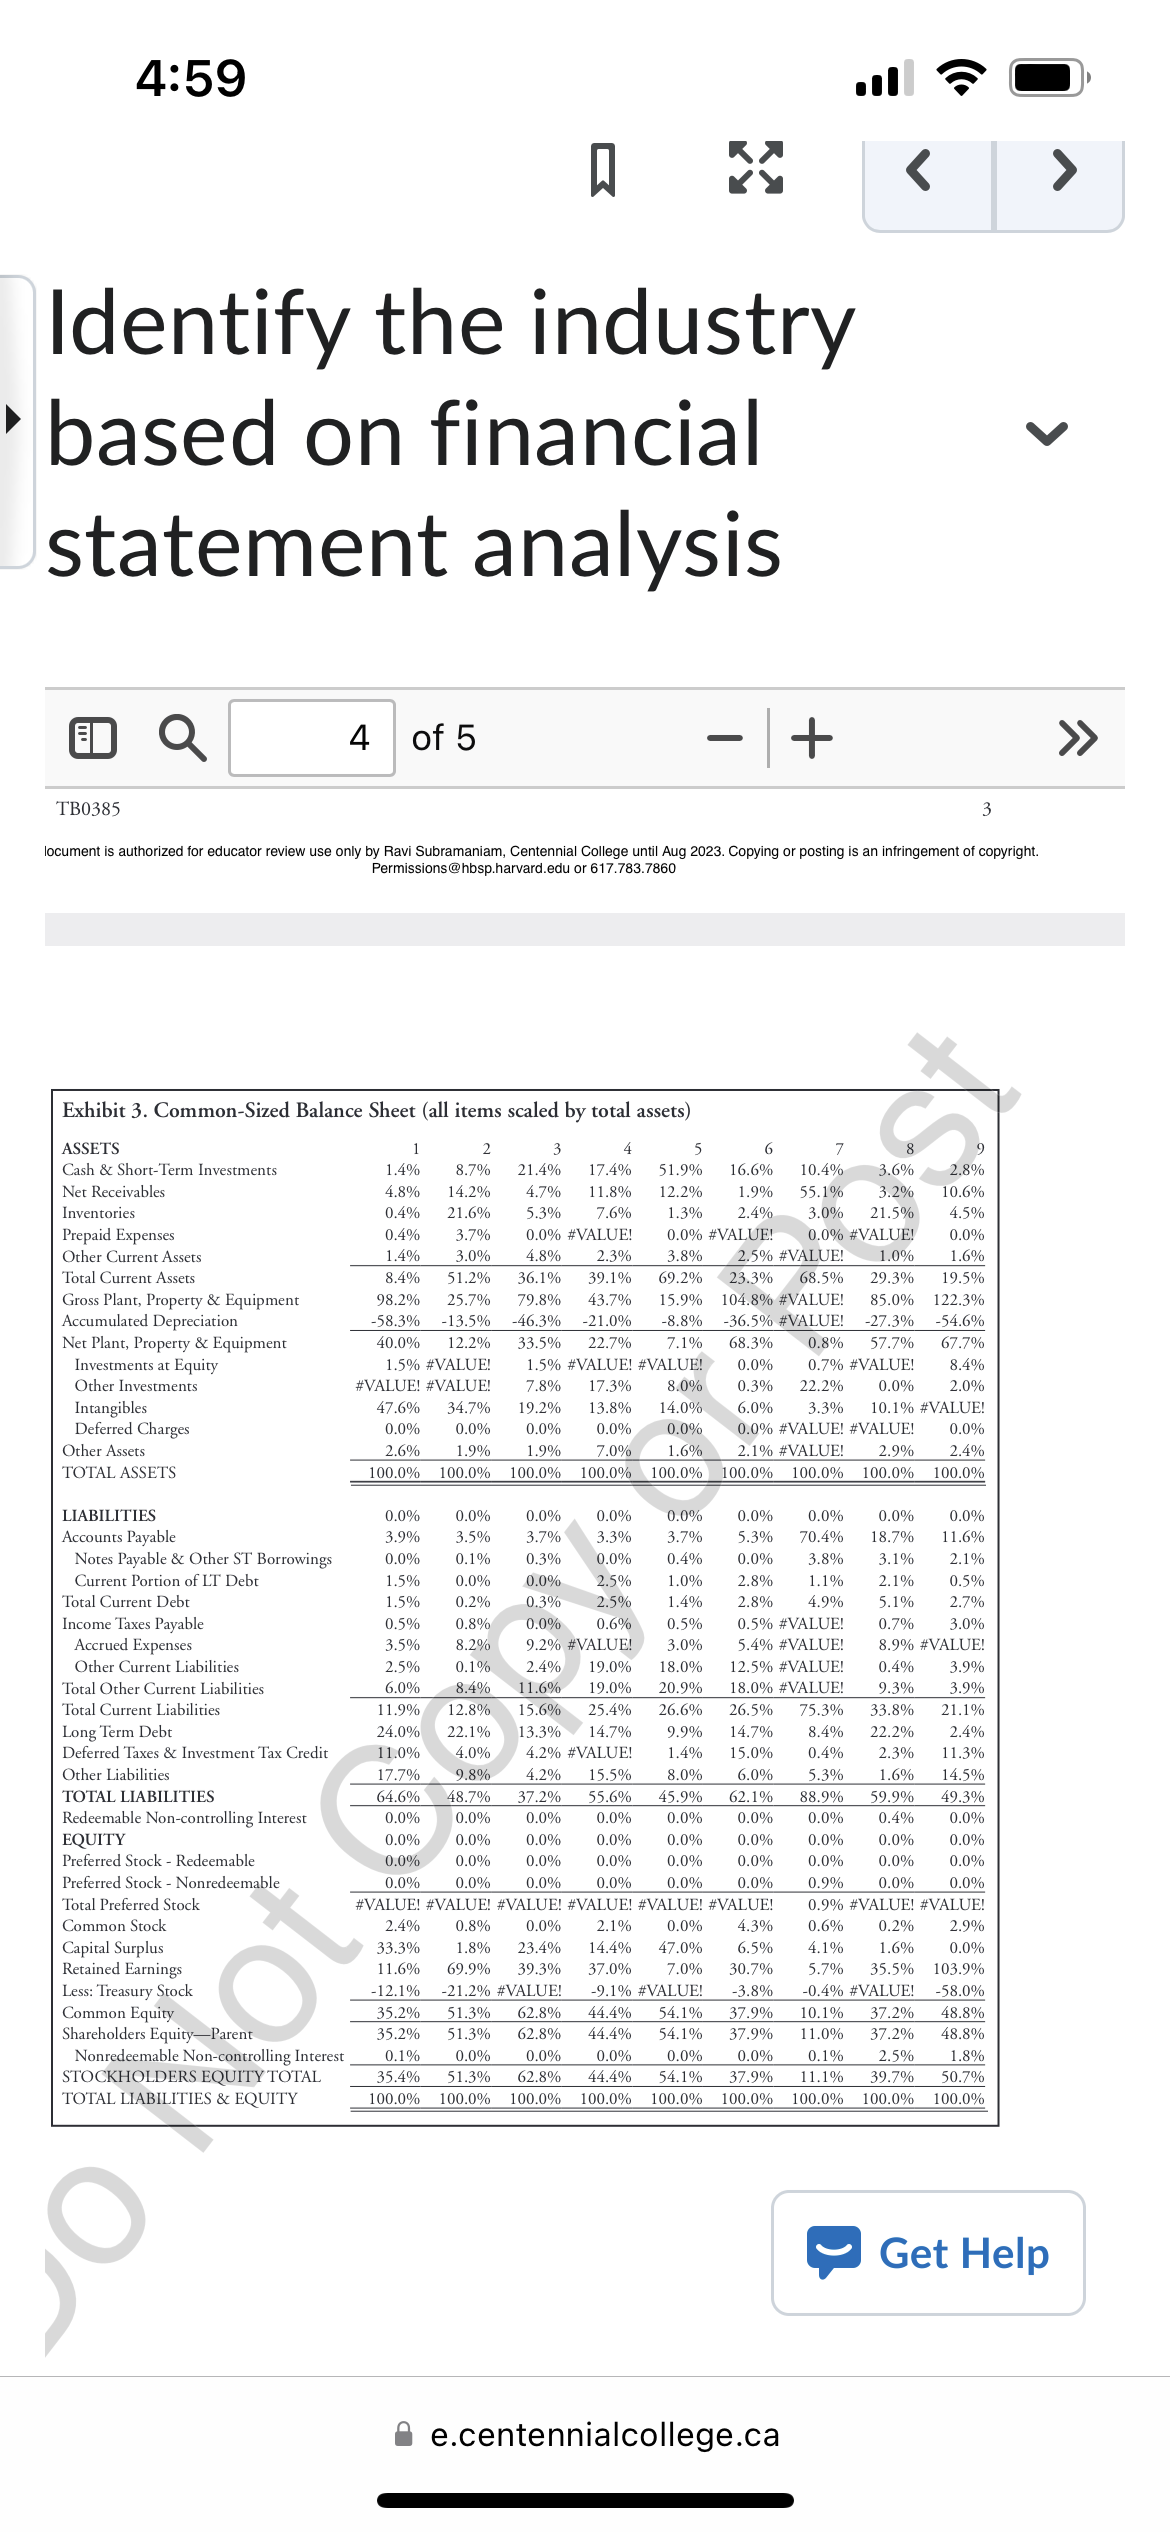
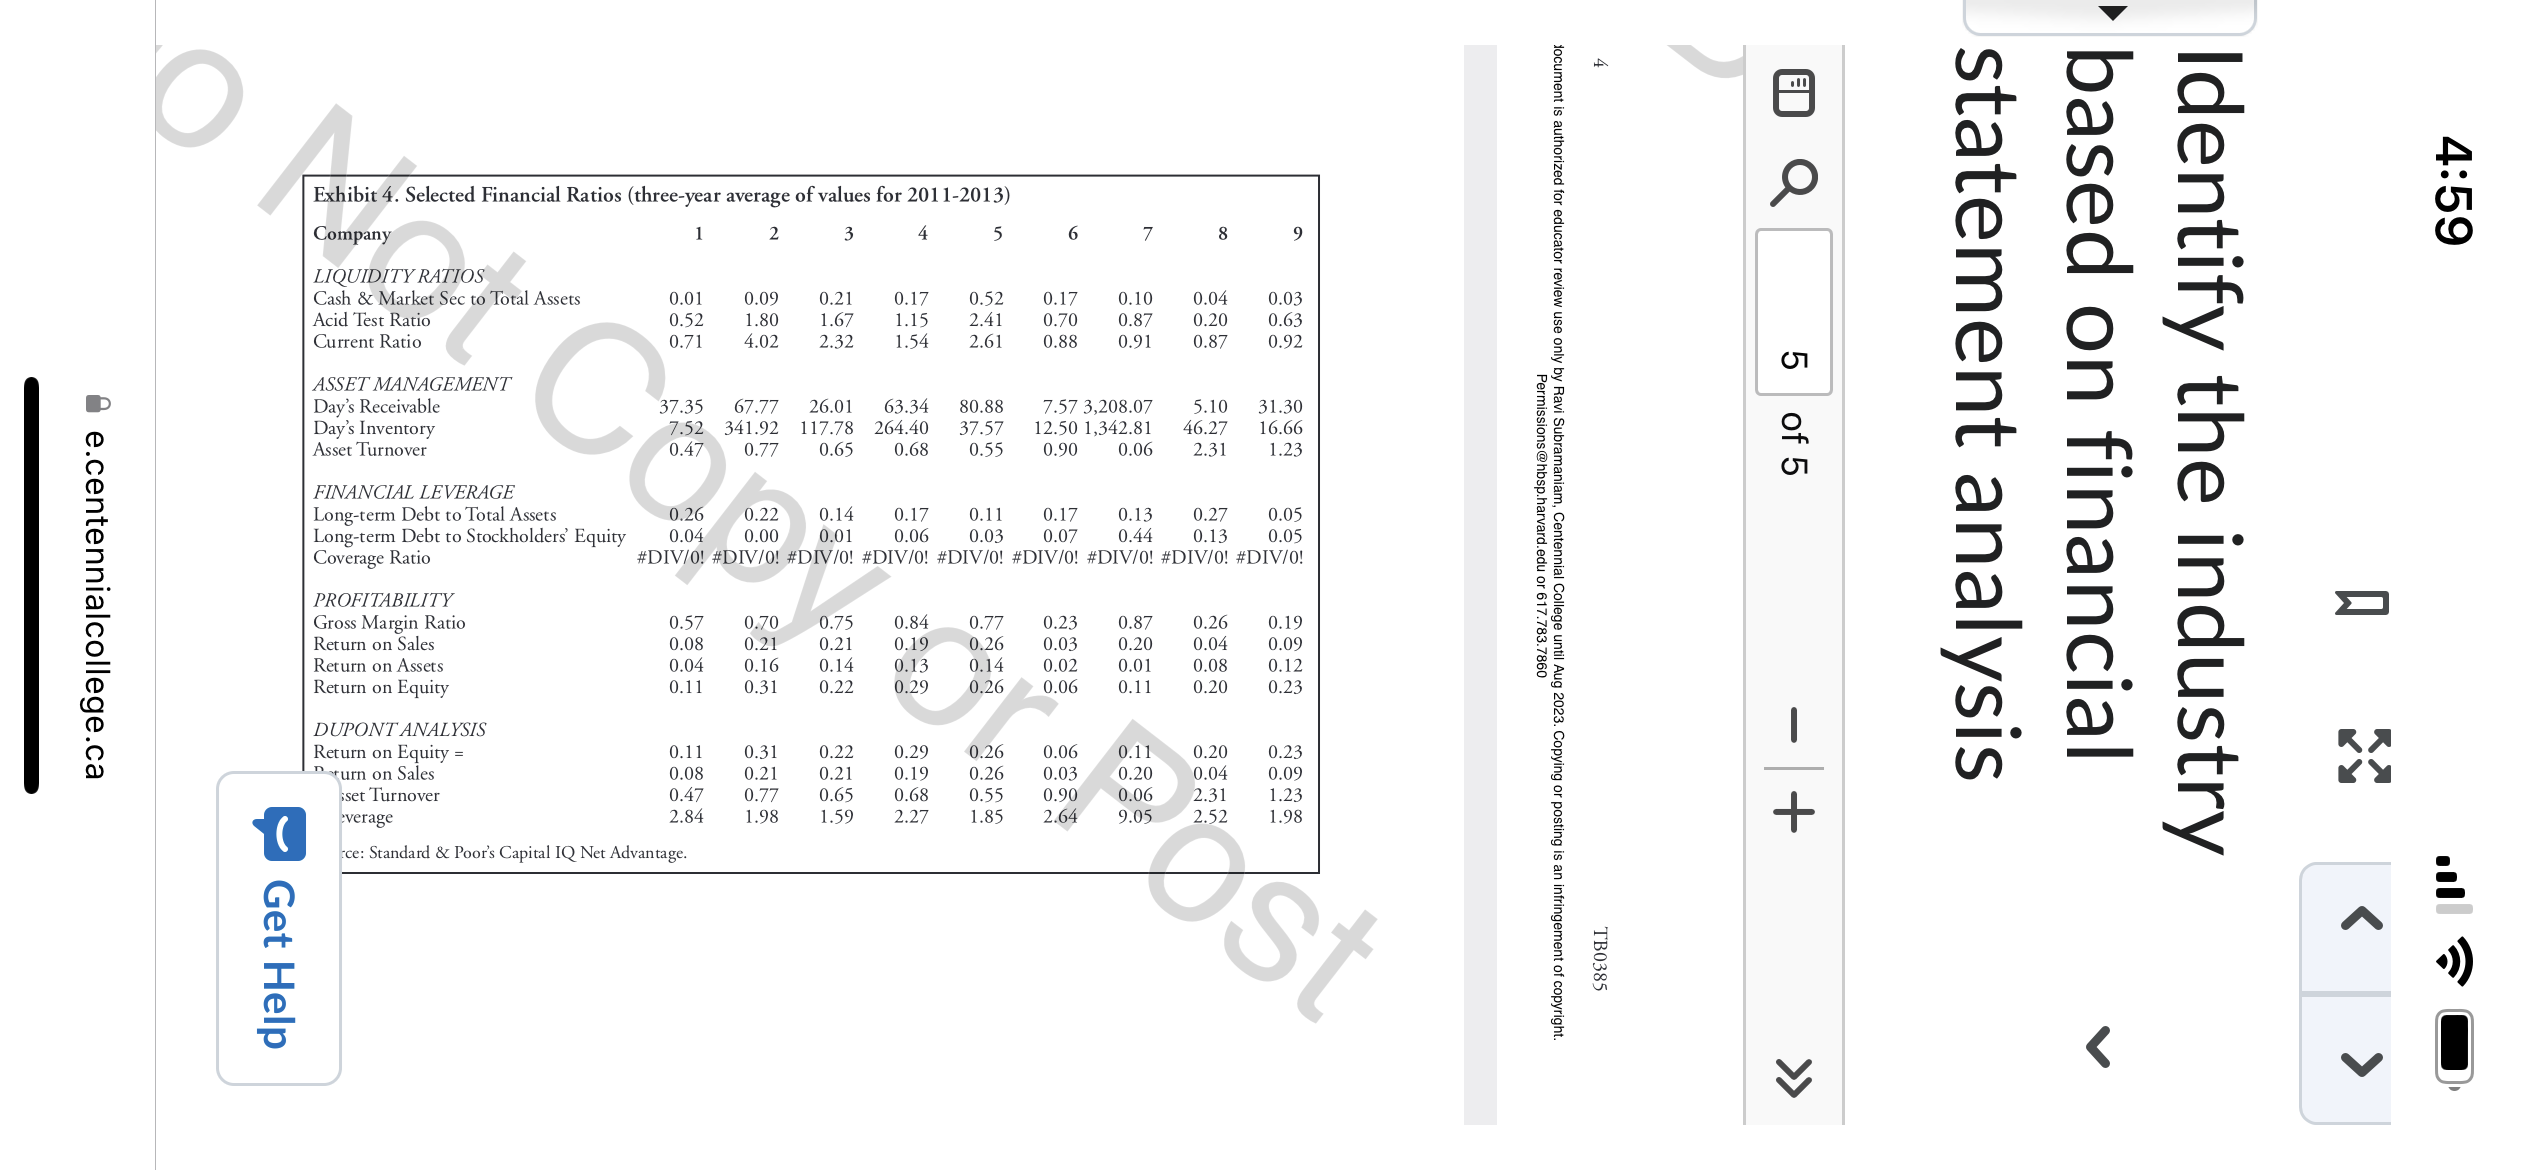
4:58 > Identify the industry based on financial V statement analysis ED Q 1 of 5 + > > THUNDERBIRD SCHOOL OF GLOBAL MANAGEMENT TB0385 OS GRAEME RANKINE IDENTIFY THE INDUSTRY-ANALYSIS OF FINANCIAL STATEMENT DATA Since companies in the same industry face similar opportunities and constraints, they tend to make similar invest- ment, dividend, and financing decisions. Thus, the financial characteristics of firms in the same industry tend to cluster together. For example, old economy businesses with large amounts of tangible assets may have higher leverage ratios because such assets provide good collateral for lenders. Service or trading firms may have large amounts of intangible assets such as knowledge assets or a large and loyal customer base, and, hence, have low leverage ratios because growth options can devalue quickly. On the other hand, companies in different industries tend to exhibit different financial characteristics, as measured by financial ratios, because of cross-sectional dif- ferences in operating and financing decisions. With some knowledge of the different operating, investing, and financing decisions across industries, financial ratios may be used to identify an industry (see Exhibit 1 for the definition of ratios used). Common-sized balance sheets (all items scaled by total assets), common-sized income statements (all items scaled by net sales), and selected financial ratios for the nine companies are provided. Since unusual deviation from target values may occur in any given year, the values for the items were averaged over three years. The three- year average common-sized balance sheet, common-sized income statement, and financial ratios are reported in Exhibits 2, 3, and 4, respectively. The 9 companies are drawn from the following 9 different industries: . Liquor producer and distributor Discount airline Commercial bank (items fitted into the same categories as the non-financial firms) Computer software company Large integrated oil and gas company . Mobile phone service operator R&D-based pharmaceutical manufacturer . Retail grocery company R&D-based semiconductor manufacturer Assignment Using the financial statement data provided in Exhibits 2, 3, and 4, match the companies with their industry. NOTE: #DIV/O! or #Value! indicates that the item was not separately disclosed. Copyright @ 2014 Thunderbird School of Global Management. All rights reserved. This c Rankine for the purpose of classroom discussion only, and not to indicate either effective or Get Help This document is authorized for educator review use only by Ravi Subramaniam, Centennial College until Aug 2023 Permissions @hosp.harvard.edu or 617.783.7860 e.centennialcollege.ca4:58 > Identify the industry based on financial V statement analysis ED Q 2 of 5 + > > This document is authorized for educator review use only by Ravi Subramaniam, Centennial College until Aug 2023. Copying or posting is an infringement of copyright. Permissions@hosp.harvard.edu or 617.783.7860 Exhibit 1. Definitions of Some Key Financial Ratios LIQUIDITY RATIOS Cash & Marketable Securities to Total Assets = (Cash + Market Securities) / Total Assets Acid Test Ratio = (Cash + Market Securities + Receivables) / Current Liabilities Current ratio = Current Assets / Current Liabilities ASSET MANAGEMENT Day's Receivable 365 / (Sales / Receivables) Day's Inventory = 365 / (Cost of Sales / Inventory) Asset Turnover Sales / Total Assets FINANCIAL LEVERAGE Debt to Total Assets (Total Current Debt + Long-term Debt) / Total Assets Debt to Stockholders' Equity = (Total Current Debt + Long-term Debt) / Stockholders' Equity Coverage Ratio = (Operating Profit + Interest Expense) / Interest Expense PROFITABILITY Gross Margin Ratio = Gross Profit / Sales Return on Sales = Net Income / Sales Return on Assets = Net Income / Total Assets Return on Equity = Net Income / Stockholders' Equity DUPONT ANALYSIS Return on Equity = Return on Sales * Asset Turnover * Leverage (Net Income / Sales) x (Sales / Assets) x (Assets / Stockholders' Equity) Do Not Co Get Help e.centennialcollege.caExhibit 2. CommonShed Income Statement (all items scaled by sales) Company 1 Sales 100.0% Cost ofGoods Sold 42.9% 2 100.0% 30.3% 3 100.0% 25.2% 4 100.0% 15.6% 5 100.0% 22.7% 6 100.0% 77.3% 7 100.0% 12.6% 8 100.0% 73.0% 9 100.0% 80.7% Gross Prot 57.1% 69.7% 57.2% 74.8% 33.1% 84.4% 54.8% 77.3% 38.096 22.7% 1 1.9% 87.4% 38.1%) 26.4% 19.1%) 19.3% 3.8% Selling, General, 8{ Administrative Exp. 27.1% Operating Income before Depreciation 30.1% Depreciation, Depletion 8C Amortization 14.3% 32.5% 1.8% 41.7% 13.5% 29.6% 5.5% 39.3% 4.3% 10.7% 4.8% 49.3% 3.1% 7.3% 1.8% 15.5% 3.9% Operating Prot 15.7% Interest Expense 0.0% Non-Operating IncomefExpense 1.0% Special Items 22% 30.8% 0.0% 0.3% 70.1% 28.1% 0.0% 1.1% 70.3% 24.1% 0.0% 0.5% 0.1% 35.0% 0.0%) 1.0% 73.0% 5.9% 0.0% 0.1% 70.8% 46.2% 0.0% 713.4% 71.0% 5.5% 0.0% 0.5% 0.0% l 1.6% 0.0% 4.9% 0.5% Pretax Income 11.7% Total Income Taxes 38% 30.0% 9.4% 28.2%] 7.3% 23.8% 5.1% 32.4% 6.8% 4.3% 1.7% 31.8% 10.1% 5.4% 1.7% 10.8%) 6.9% Income Before Extraordinary Items 8c Noncontrolling Interest 7.9% Net Income 7.7% 20.5% 20.5% 21.0% 21.0% 18.8% 18.8% 25.5% 25.5% 2.6% 2.6% 21.7% 20.2% 3.7% 3.5% 9.9% 9.5% Source: Standard t Puur'a Capital IQ Net Advantage. \f\f
Step by Step Solution
There are 3 Steps involved in it
Step: 1
Get Instant Access to Expert-Tailored Solutions
See step-by-step solutions with expert insights and AI powered tools for academic success
Step: 2
Step: 3
Ace Your Homework with AI
Get the answers you need in no time with our AI-driven, step-by-step assistance