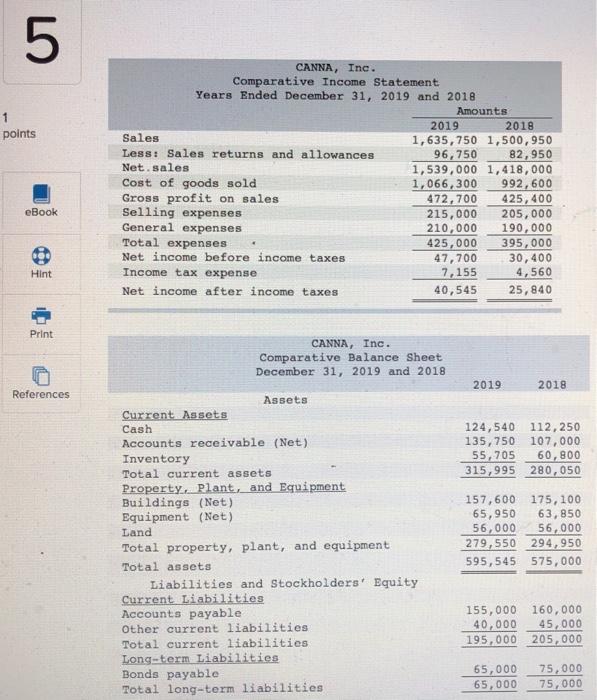
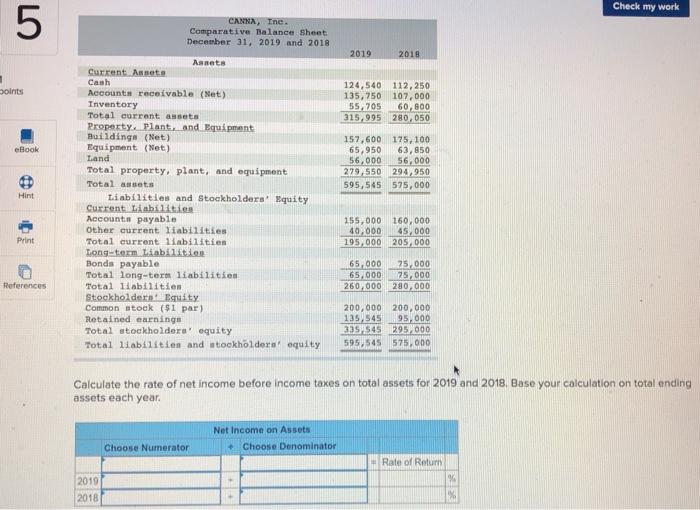
5 1 points CANNA, Ine. Comparative Income Statement Years Ended December 31, 2019 and 2018 Amounts 2019 2018 Sales 1,635,750 1,500,950 Less: Sales returns and allowances 96, 750 82,950 Net. sales 1,539,000 1,418,000 Cost of goods sold 1,066,300 992,600 Gross profit on sales 472,700 425, 400 Selling expenses 215,000 205,000 General expenses 210,000 190,000 Total expenses 425,000 395,000 Net income before income taxes 47,700 30,400 Income tax expense 7,155 4,560 Net income after income taxes 40,545 25,840 eBook Hint Print CANNA, Inc. Comparative Balance Sheet December 31, 2019 and 2018 2019 2018 References 124,540 112,250 135,750 107.000 55,705 60,800 315,995 280,050 Assets Current Assets Cash Accounts receivable (Net) Inventory Total current assets Property. Plant, and Equipment Buildings (Net) Equipment (Net) Land Total property, plant, and equipment Total assets Liabilities and Stockholders' Equity Current Liabilities Accounts payable Other current liabilities Total current liabilities Long-term Liabilities Bonds payable Total long-term liabilities 157,600 175, 100 65,950 63,850 56,000 56,000 279,550 294,950 595,545 575,000 155,000 160,000 40,000 45,000 195,000 205,000 65,000 65,000 75,000 75,000 Check my work 5 CANNA, Ine. Comparative Balance Sheet December 31, 2019 and 2018 2019 2018 Joints 124,540 112,250 135,750 107.000 55,705 60, 600 315,995 280,050 eBook 157,600 175, 100 65,950 63,850 56,000 56,000 279,550 294,950 595,545.575,000 Hint Assets Current Annet Cash Accounts receivable (Net) Inventory Total current assets Property. Plant, and Equipment Buildings (Net) Equipment (Net) Land Total property, plant, and equipment Total assets Liabilities and Stockholders' Aquity Current Liabilities Accounts payable Other current liabilities Total current liabilities Long-term Liabilitian Bonds payable Total long-term liabilities Total liabilities Stockholders. Equity Common stock ($1 par) Retained earnings Total stockholders' equity Total liabilities and stockholders equity 155,000 160,000 40.000 45,000 195,000 205,000 Print 65.000 25,000 65,000 25,000 260.000 280,000 References 200,000 125,545 335 545 595,545 200,000 95,000 295,000 575,000 Calculate the rate of net income before income taxes on total assets for 2019 and 2018. Base your calculation on total ending assets each year Net Income on Assets + Choose Denominator Choose Numerator Rate of Relum % 2019 2018


