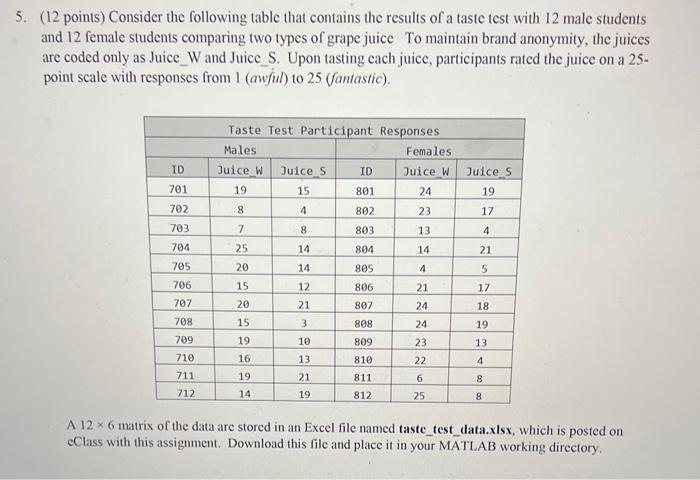
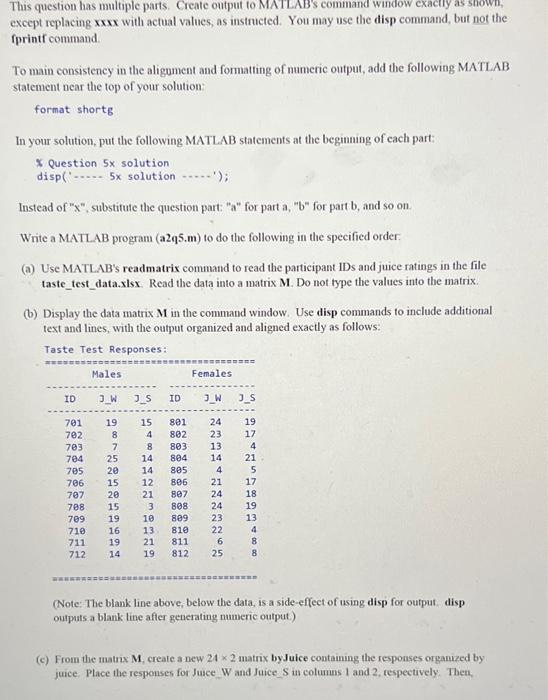
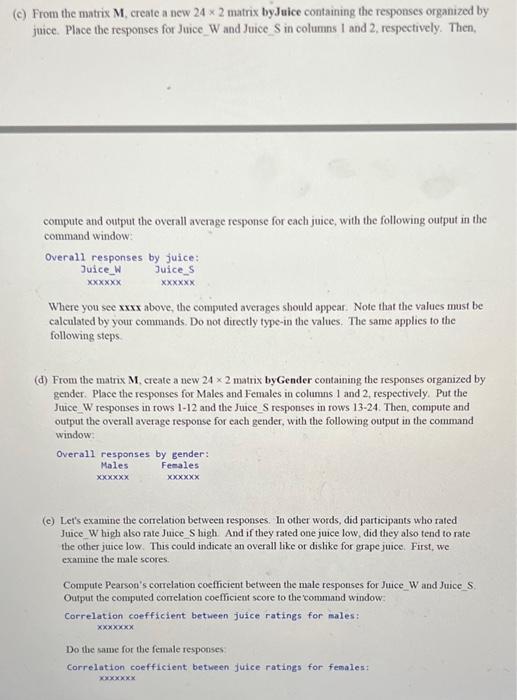
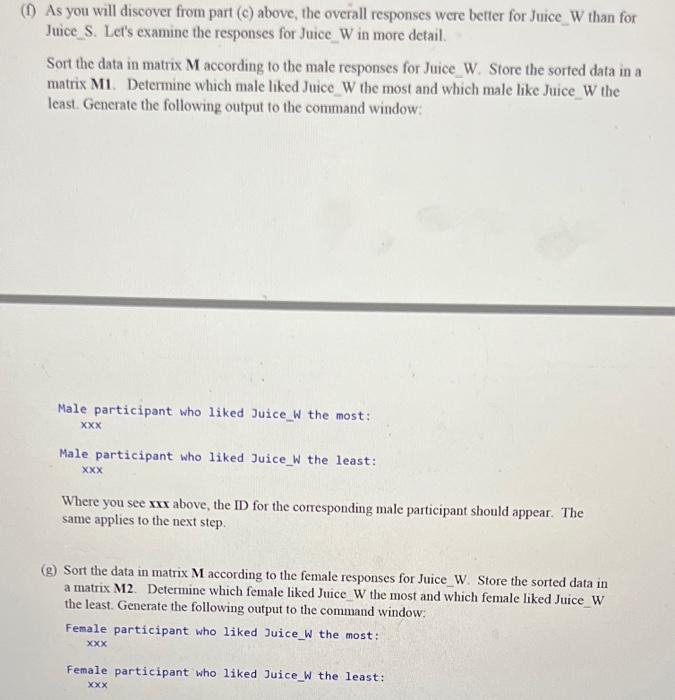
5. ( 12 points) Consider the following table that contains the results of a taste test with 12 male students and 12 female students comparing two types of grape juice To maintain brand anonymity, the juices are coded only as Juice_W and Juice_S. Upon tasting each juice, participants rated the juice on a 25point scale with responses from 1 ( awful) to 25 (fantastic). A 126 matrix of the data are stored in an Excel file named taste_test_data.xlsx, which is posted on eClass with this assignment. Download this file and place it in your MATLAB working directory. This question has multiple parts. Create output to MATLAB's command window cxacily as snown, except replacing xxx with actual values, as instructed. You may use the disp command, but not the fprintf command To main consistency in the aligument and formatting of numeric output, add the following MATL AB statement near the top of your solution: format shortg In your solution, put the following MATLAB statements at the beginning of cach part: \$ Question 5 solution disp(".... 5x solution ....') Instead of " x ", substitute the question part: "a" for part a, " b " for part b, and so on. Write a MATLAB program (a2q5.m) to do the following in the specified order: (a) Use MATLAB's readmatrix command to read the participant IDs and juice ratings in the file taste_test_data.xlsx. Read the data into a matrix M. Do not type the values into the matrix. (b) Display the data matrix M in the command window. Use disp commands to include additional text and lines, with the output organized and aligned exactly as follows: Taste Test Responses: (Note: The blank line above, below the data, is a side-effect of using disp for output. disp outputs a blank line after generating numeric output.) (c) From the matrix M, creale a new 242 matrix by Juice containing the responses organized by juice. Place the responses for Juce W and Juice S in columns 1 and 2 , respectively. Then, (c) From the matrix M, create a new 242 matrix byJuice containing the responses organized by juice. Place the responses for Juice_ W and Juice S in columns I and 2, respectively. Then, compute and output the overall average response for each juice, with the following output in the command window: Overa11 responses by juice: Juice_W Juice_s xoxxxxx xxxxxx Where you see xxxx above, the computed averages should appear. Note that the values must be calculated by your commands. Do not directly type-in the values. The same applies to the following steps (d) From the matrix M, create a new 242 matrix byGender containing the responses organized by gender. Place the responses for Males and Females in columns 1 and 2, respectively. Put the Juice. W responses in rows 1-12 and the Juice_S responses in rows 13-24. Then, compute and output the overall average response for each gender, with the following output in the command window: Overall responses by gender: Males Feeales xxxxxx poxxxx (c) Let's examine the correlation between responses. In other words, did participants who rated Juice Whigh also rate Juice S high. And if they rated one juice low, did they also tend to rate the other juice low. This could indieate an overall like or dislike for gape juice, First, we examine the male scores. Compute Pearson's correlation coefficient between the male responses for Juice W and Juice S. Output the computed correlation coefficient score to the command window: Correlation coefficient between juice ratings for males: x00000x Do the same for the female responses: Correlation coefficient between juice ratings for females: xox0000x (f) As you will discover from part (c) above, the overall responses were better for Juice W than for Juice S. Let's examine the responses for Juice_W in more detail. Sort the data in matrix M according to the male responses for Juice_W. Store the sorted data in a matrix M1. Determine which male liked Juice_W the most and which male like Juice_W the least. Generate the following output to the command window: Male participant who liked Juice_W the most: xx Male participant who liked Juice_W the least: xxx Where you see xxx above, the ID for the corresponding male participant should appear. The same applies to the next step. (g) Sort the data in matrix M according to the female responses for Juice_W. Store the sorted data in a matrix M2. Determine which female liked Juice W the most and which female liked Juice_W the least. Generate the following output to the command window: Female participant who liked Juice_W the most: xxx Female participant who liked Juice_w the least: xxx


