

Answered step by step
Verified Expert Solution
Question
1 Approved Answer
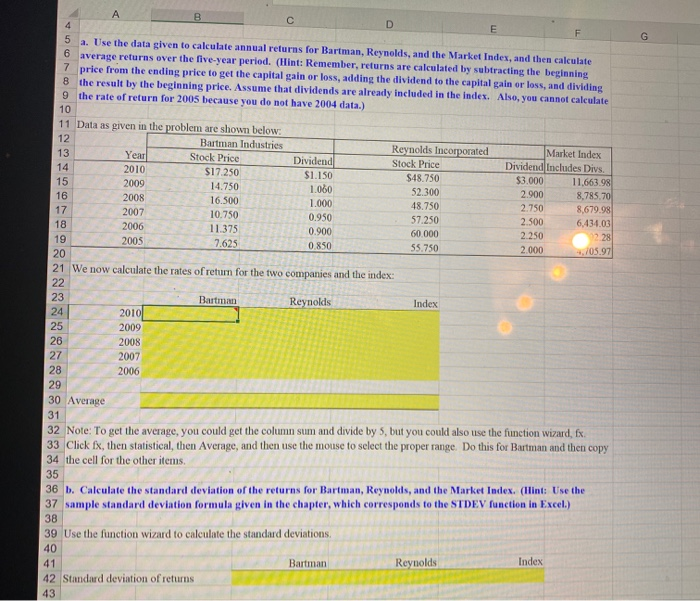
5 6 7 8 9 . Use the data given to calculate annual returns for Bartman, Reynolds, and the Market Index, and then calculate average
Step by Step Solution
There are 3 Steps involved in it
Step: 1

Get Instant Access to Expert-Tailored Solutions
See step-by-step solutions with expert insights and AI powered tools for academic success
Step: 2

Step: 3
Ace Your Homework with AI
Get the answers you need in no time with our AI-driven, step-by-step assistance
Get Started
Handbook Of The Economics Of Finance Corporate Finance Volume 1A
Authors: George M. Constantinides, M. Harris, Rene M. Stulz
1st Edition
0444513620, 978-0444513625