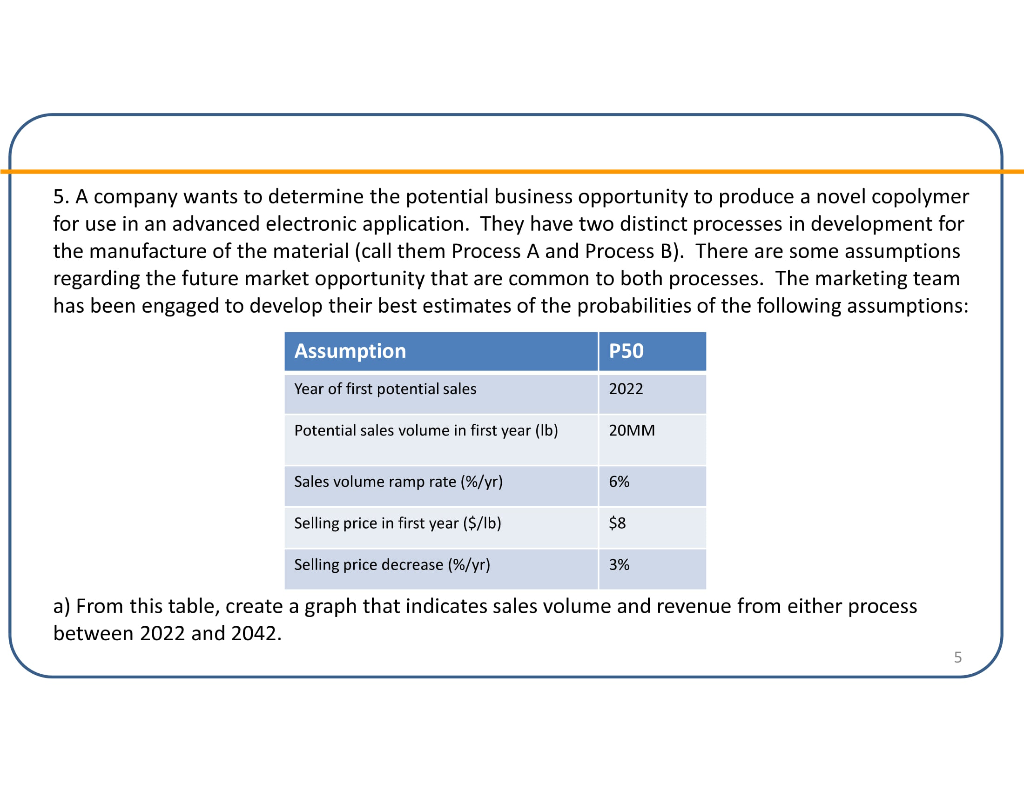
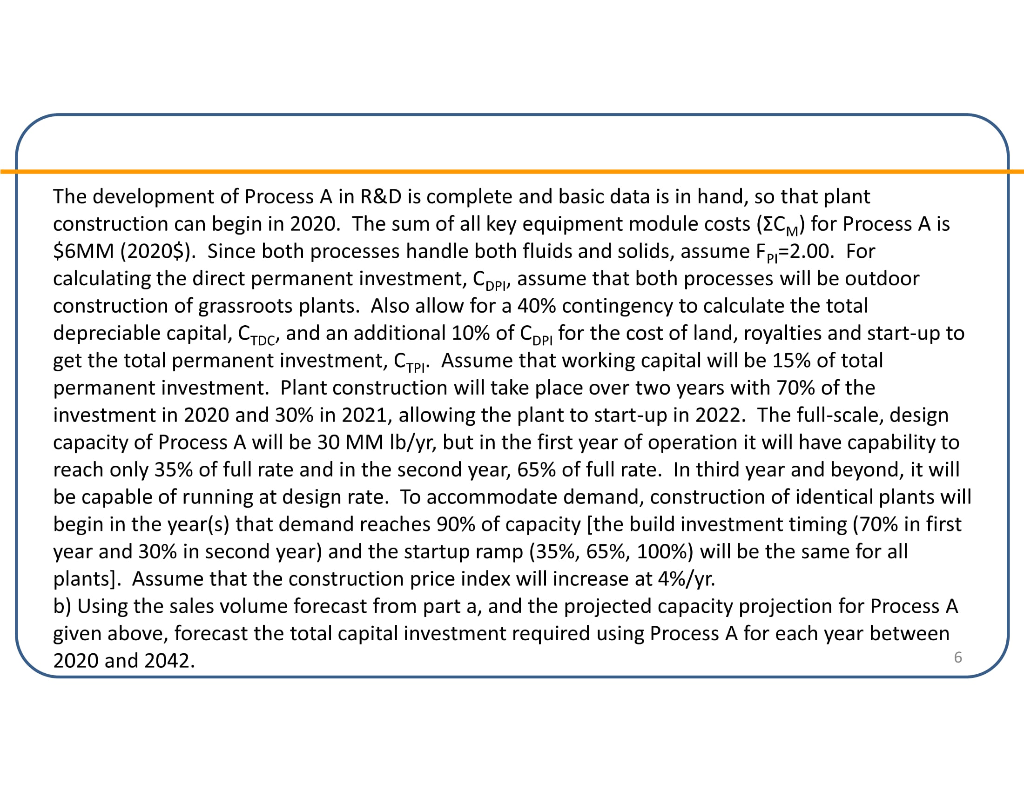
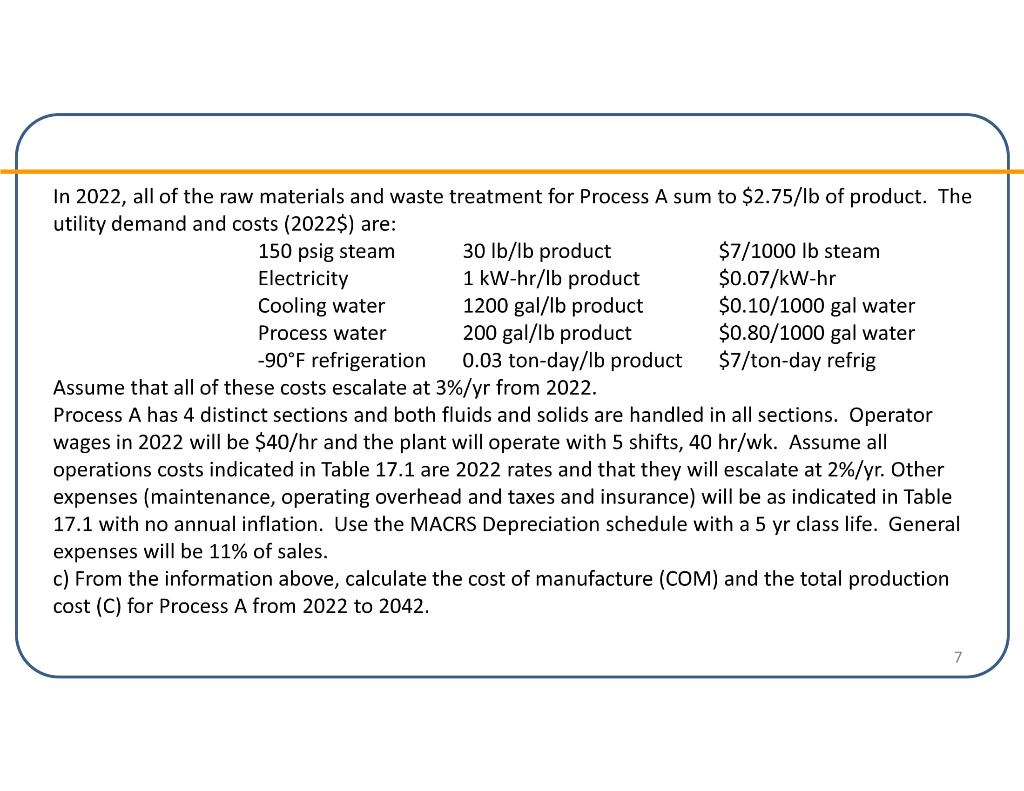
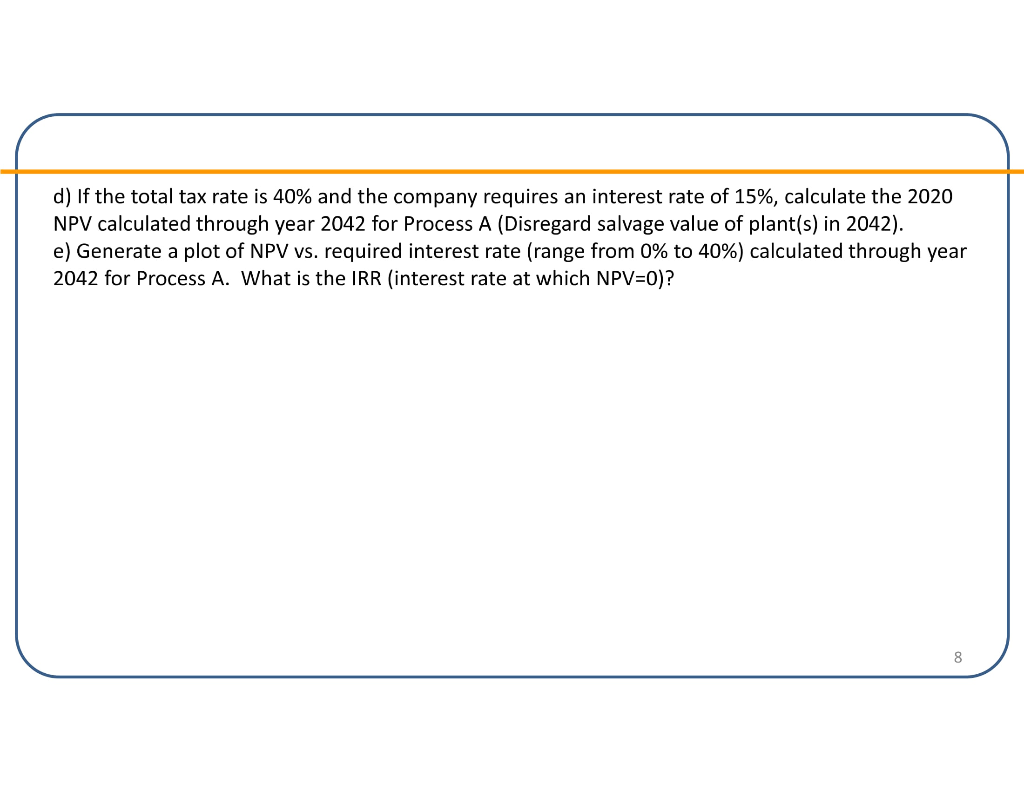
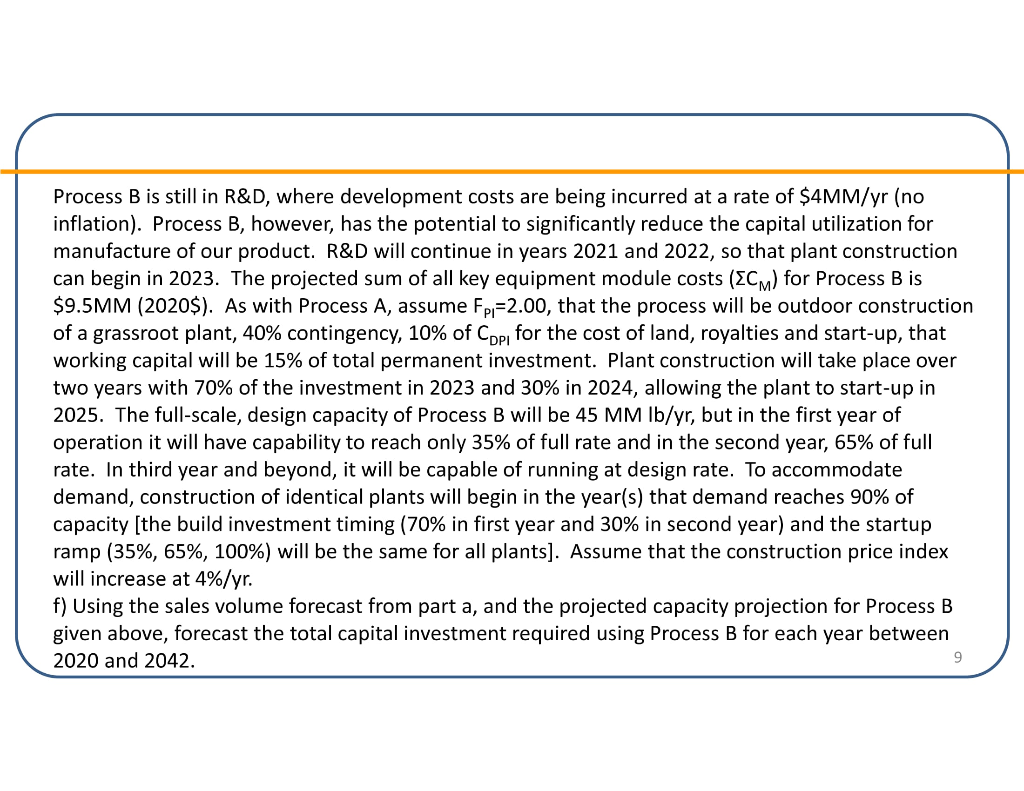
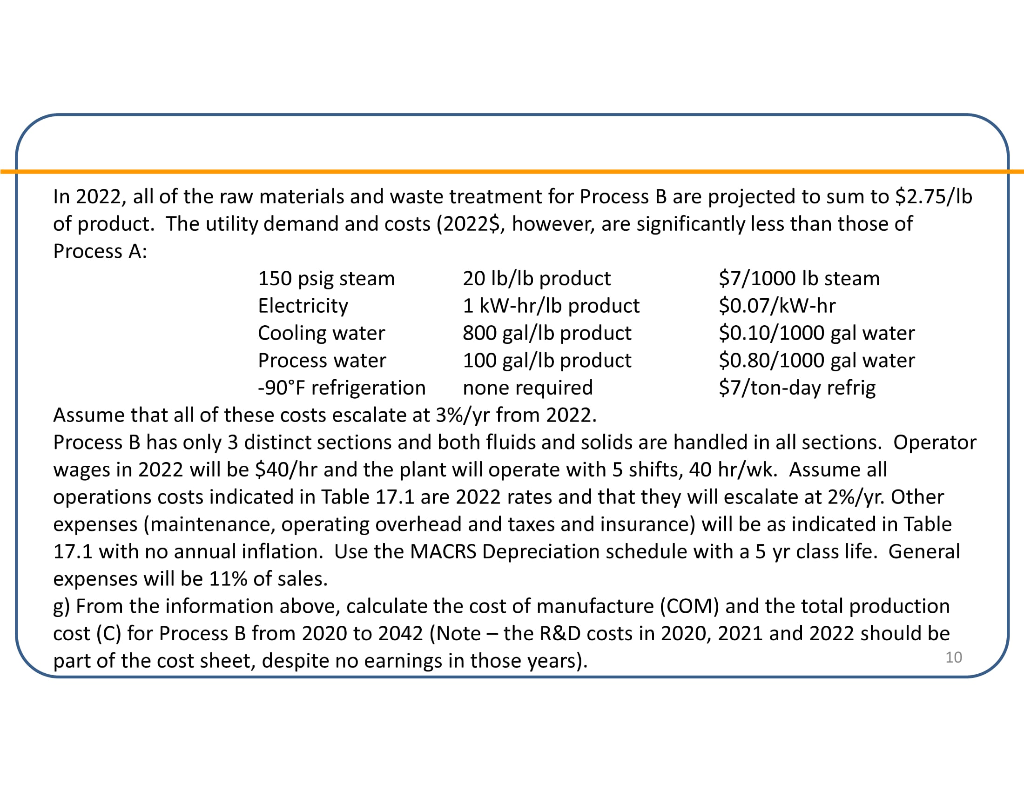
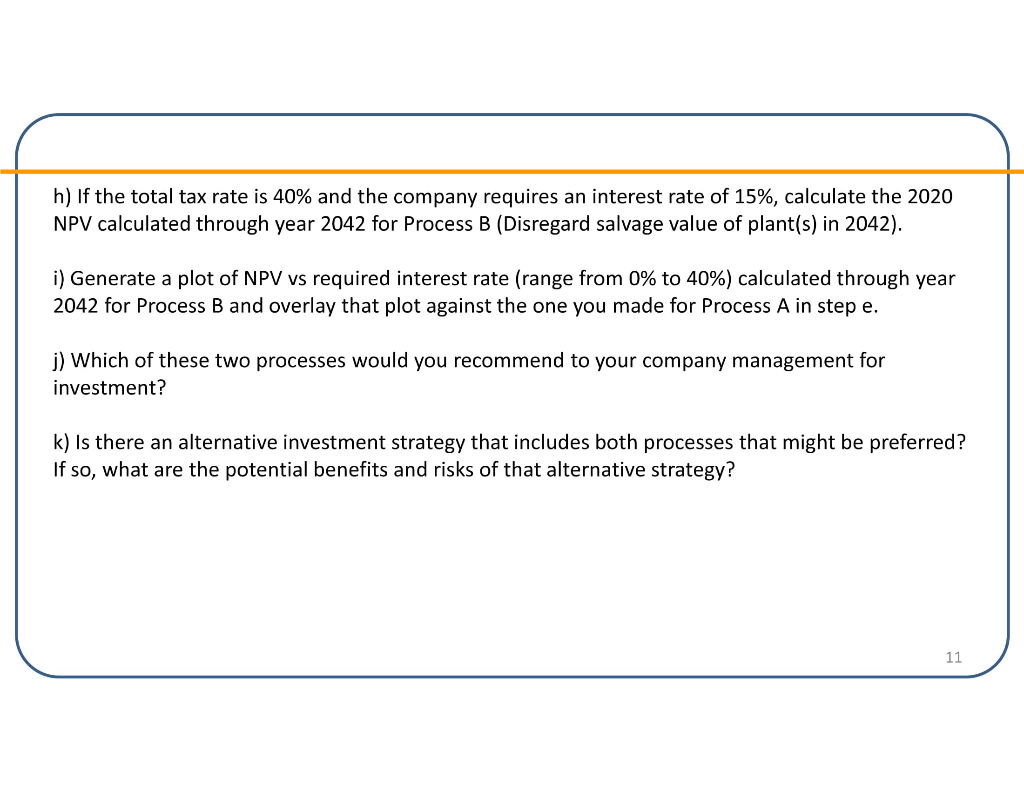
5. A company wants to determine the potential business opportunity to produce a novel copolymer for use in an advanced electronic application. They have two distinct processes in development for the manufacture of the material (call them Process A and Process B). There are some assumptions regarding the future market opportunity that are common to both processes. The marketing team has been engaged to develop their best estimates of the probabilities of the following assumptions: Assumption P50 Year of first potential sales 2022 Potential sales volume in first year (lb) 20MM Sales volume ramp rate (%/yr) 6% Selling price in first year ($/lb) $8 Selling price decrease %/yr) 3% a) From this table, create a graph that indicates sales volume and revenue from either process between 2022 and 2042. The development of Process A in R&D is complete and basic data is in hand, so that plant construction can begin in 2020. The sum of all key equipment module costs (ECM) for Process A is $6MM (2020$). Since both processes handle both fluids and solids, assume Fp=2.00. For calculating the direct permanent investment, Cpp, assume that both processes will be outdoor construction of grassroots plants. Also allow for a 40% contingency to calculate the total depreciable capital, Croc, and an additional 10% of Cop for the cost of land, royalties and start-up to get the total permanent investment, Ctei. Assume that working capital will be 15% of total permanent investment. Plant construction will take place over two years with 70% of the investment in 2020 and 30% in 2021, allowing the plant to start-up in 2022. The full-scale, design capacity of Process A will be 30 MM Ib/yr, but in the first year of operation it will have capability to reach only 35% of full rate and in the second year, 65% of full rate. In third year and beyond, it will be capable of running at design rate. To accommodate demand, construction of identical plants will begin in the year(s) that demand reaches 90% of capacity (the build investment timing (70% in first year and 30% in second year) and the startup ramp (35%, 65%, 100%) will be the same for all plants). Assume that the construction price index will increase at 4%/yr. b) Using the sales volume forecast from part a, and the projected capacity projection for Process A given above, forecast the total capital investment required using Process A for each year between 2020 and 2042. 1200 In 2022, all of the raw materials and waste treatment for Process A sum to $2.75/lb of product. The utility demand and costs (2022$) are: 150 psig steam 30 lb/lb product $7/1000 lb steam Electricity 1 kW-hr/Ib product $0.07/kW-hr Cooling water 1200 gal/lb product $0.10/1000 gal water Process water 200 gal/lb product $0.80/1000 gal water -90F refrigeration 0.03 ton-day/lb product $7/ton-day refrig Assume that all of these costs escalate at 3%/yr from 2022. Process A has 4 distinct sections and both fluids and solids are handled in all sections. Operator wages in 2022 will be $40/hr and the plant will operate with 5 shifts, 40 hr/wk. Assume all operations costs indicated in Table 17.1 are 2022 rates and that they will escalate at 2%/yr. Other expenses (maintenance, operating overhead and taxes and insurance) will be as indicated in Table 17.1 with no annual inflation. Use the MACRS Depreciation schedule with a 5 yr class life. General expenses will be 11% of sales. c) From the information above, calculate the cost of manufacture (COM) and the total production cost (C) for Process A from 2022 to 2042. d) If the total tax rate is 40% and the company requires an interest rate of 15%, calculate the 2020 NPV calculated through year 2042 for Process A (Disregard salvage value of plant(s) in 2042). e) Generate a plot of NPV vs. required interest rate (range from 0% to 40%) calculated through year 2042 for Process A. What is the IRR (interest rate at which NPV=O)? Process B is still in R&D, where development costs are being incurred at a rate of $4MM/yr (no inflation). Process B, however, has the potential to significantly reduce the capital utilization for manufacture of our product. R&D will continue in years 2021 and 2022, so that plant construction can begin in 2023. The projected sum of all key equipment module costs (ECM) for Process B is $9.5MM (2020$). As with Process A, assume Fp=2.00, that the process will be outdoor construction of a grassroot plant, 40% contingency, 10% of Cppfor the cost of land, royalties and start-up, that working capital will be 15% of total permanent investment. Plant construction will take place over two years with 70% of the investment in 2023 and 30% in 2024, allowing the plant to start-up in 2025. The full-scale, design capacity of Process B will be 45 MM lb/yr, but in the first year of operation it will have capability to reach only 35% of full rate and in the second year, 65% of full rate. In third year and beyond, it will be capable of running at design rate. To accommodate demand, construction of identical plants will begin in the year(s) that demand reaches 90% of capacity (the build investment timing (70% in first year and 30% in second year) and the startup ramp (35%, 65%, 100%) will be the same for all plants]. Assume that the construction price index will increase at 4%/yr. f) Using the sales volume forecast from part a, and the projected capacity projection for Process B given above, forecast the total capital investment required using Process B for each year between 2020 and 2042. 9 In 2022, all of the raw materials and waste treatment for Process B are projected to sum to $2.75/lb of product. The utility demand and costs (2022$, however, are significantly less than those of Process A: 150 psig steam 20 lb/lb product $7/1000 lb steam Electricity 1 kW-hr/lb product $0.07/kW-hr Cooling water 800 gal/lb product $0.10/1000 gal water Process water 100 gal/lb product $0.80/1000 gal water -90F refrigeration none required $7/ton-day refrig Assume that all of these costs escalate at 3%/yr from 2022. Process B has only 3 distinct sections and both fluids and solids are handled in all sections. Operator wages in 2022 will be $40/hr and the plant will operate with 5 shifts, 40 hr/wk. Assume all operations costs indicated in Table 17.1 are 2022 rates and that they will escalate at 2%/yr. Other expenses (maintenance, operating overhead and taxes and insurance) will be as indicated in Table 17.1 with no annual inflation. Use the MACRS Depreciation schedule with a 5 yr class life. General expenses will be 11% of sales. g) From the information above, calculate the cost of manufacture (COM) and the total production cost (C) for Process B from 2020 to 2042 (Note - the R&D costs in 2020, 2021 and 2022 should be part of the cost sheet, despite no earnings in those years). 10 h) If the total tax rate is 40% and the company requires an interest rate of 15%, calculate the 2020 NPV calculated through year 2042 for Process B (Disregard salvage value of plant(s) in 2042). i) Generate a plot of NPV vs required interest rate (range from 0% to 40%) calculated through year 2042 for Process B and overlay that plot against the one you made for Process A in step e. j) Which of these two processes would you recommend to your company management for investment? k) Is there an alternative investment strategy that includes both processes that might be preferred? If so, what are the potential benefits and risks of that alternative strategy? 5. A company wants to determine the potential business opportunity to produce a novel copolymer for use in an advanced electronic application. They have two distinct processes in development for the manufacture of the material (call them Process A and Process B). There are some assumptions regarding the future market opportunity that are common to both processes. The marketing team has been engaged to develop their best estimates of the probabilities of the following assumptions: Assumption P50 Year of first potential sales 2022 Potential sales volume in first year (lb) 20MM Sales volume ramp rate (%/yr) 6% Selling price in first year ($/lb) $8 Selling price decrease %/yr) 3% a) From this table, create a graph that indicates sales volume and revenue from either process between 2022 and 2042. The development of Process A in R&D is complete and basic data is in hand, so that plant construction can begin in 2020. The sum of all key equipment module costs (ECM) for Process A is $6MM (2020$). Since both processes handle both fluids and solids, assume Fp=2.00. For calculating the direct permanent investment, Cpp, assume that both processes will be outdoor construction of grassroots plants. Also allow for a 40% contingency to calculate the total depreciable capital, Croc, and an additional 10% of Cop for the cost of land, royalties and start-up to get the total permanent investment, Ctei. Assume that working capital will be 15% of total permanent investment. Plant construction will take place over two years with 70% of the investment in 2020 and 30% in 2021, allowing the plant to start-up in 2022. The full-scale, design capacity of Process A will be 30 MM Ib/yr, but in the first year of operation it will have capability to reach only 35% of full rate and in the second year, 65% of full rate. In third year and beyond, it will be capable of running at design rate. To accommodate demand, construction of identical plants will begin in the year(s) that demand reaches 90% of capacity (the build investment timing (70% in first year and 30% in second year) and the startup ramp (35%, 65%, 100%) will be the same for all plants). Assume that the construction price index will increase at 4%/yr. b) Using the sales volume forecast from part a, and the projected capacity projection for Process A given above, forecast the total capital investment required using Process A for each year between 2020 and 2042. 1200 In 2022, all of the raw materials and waste treatment for Process A sum to $2.75/lb of product. The utility demand and costs (2022$) are: 150 psig steam 30 lb/lb product $7/1000 lb steam Electricity 1 kW-hr/Ib product $0.07/kW-hr Cooling water 1200 gal/lb product $0.10/1000 gal water Process water 200 gal/lb product $0.80/1000 gal water -90F refrigeration 0.03 ton-day/lb product $7/ton-day refrig Assume that all of these costs escalate at 3%/yr from 2022. Process A has 4 distinct sections and both fluids and solids are handled in all sections. Operator wages in 2022 will be $40/hr and the plant will operate with 5 shifts, 40 hr/wk. Assume all operations costs indicated in Table 17.1 are 2022 rates and that they will escalate at 2%/yr. Other expenses (maintenance, operating overhead and taxes and insurance) will be as indicated in Table 17.1 with no annual inflation. Use the MACRS Depreciation schedule with a 5 yr class life. General expenses will be 11% of sales. c) From the information above, calculate the cost of manufacture (COM) and the total production cost (C) for Process A from 2022 to 2042. d) If the total tax rate is 40% and the company requires an interest rate of 15%, calculate the 2020 NPV calculated through year 2042 for Process A (Disregard salvage value of plant(s) in 2042). e) Generate a plot of NPV vs. required interest rate (range from 0% to 40%) calculated through year 2042 for Process A. What is the IRR (interest rate at which NPV=O)? Process B is still in R&D, where development costs are being incurred at a rate of $4MM/yr (no inflation). Process B, however, has the potential to significantly reduce the capital utilization for manufacture of our product. R&D will continue in years 2021 and 2022, so that plant construction can begin in 2023. The projected sum of all key equipment module costs (ECM) for Process B is $9.5MM (2020$). As with Process A, assume Fp=2.00, that the process will be outdoor construction of a grassroot plant, 40% contingency, 10% of Cppfor the cost of land, royalties and start-up, that working capital will be 15% of total permanent investment. Plant construction will take place over two years with 70% of the investment in 2023 and 30% in 2024, allowing the plant to start-up in 2025. The full-scale, design capacity of Process B will be 45 MM lb/yr, but in the first year of operation it will have capability to reach only 35% of full rate and in the second year, 65% of full rate. In third year and beyond, it will be capable of running at design rate. To accommodate demand, construction of identical plants will begin in the year(s) that demand reaches 90% of capacity (the build investment timing (70% in first year and 30% in second year) and the startup ramp (35%, 65%, 100%) will be the same for all plants]. Assume that the construction price index will increase at 4%/yr. f) Using the sales volume forecast from part a, and the projected capacity projection for Process B given above, forecast the total capital investment required using Process B for each year between 2020 and 2042. 9 In 2022, all of the raw materials and waste treatment for Process B are projected to sum to $2.75/lb of product. The utility demand and costs (2022$, however, are significantly less than those of Process A: 150 psig steam 20 lb/lb product $7/1000 lb steam Electricity 1 kW-hr/lb product $0.07/kW-hr Cooling water 800 gal/lb product $0.10/1000 gal water Process water 100 gal/lb product $0.80/1000 gal water -90F refrigeration none required $7/ton-day refrig Assume that all of these costs escalate at 3%/yr from 2022. Process B has only 3 distinct sections and both fluids and solids are handled in all sections. Operator wages in 2022 will be $40/hr and the plant will operate with 5 shifts, 40 hr/wk. Assume all operations costs indicated in Table 17.1 are 2022 rates and that they will escalate at 2%/yr. Other expenses (maintenance, operating overhead and taxes and insurance) will be as indicated in Table 17.1 with no annual inflation. Use the MACRS Depreciation schedule with a 5 yr class life. General expenses will be 11% of sales. g) From the information above, calculate the cost of manufacture (COM) and the total production cost (C) for Process B from 2020 to 2042 (Note - the R&D costs in 2020, 2021 and 2022 should be part of the cost sheet, despite no earnings in those years). 10 h) If the total tax rate is 40% and the company requires an interest rate of 15%, calculate the 2020 NPV calculated through year 2042 for Process B (Disregard salvage value of plant(s) in 2042). i) Generate a plot of NPV vs required interest rate (range from 0% to 40%) calculated through year 2042 for Process B and overlay that plot against the one you made for Process A in step e. j) Which of these two processes would you recommend to your company management for investment? k) Is there an alternative investment strategy that includes both processes that might be preferred? If so, what are the potential benefits and risks of that alternative strategy


