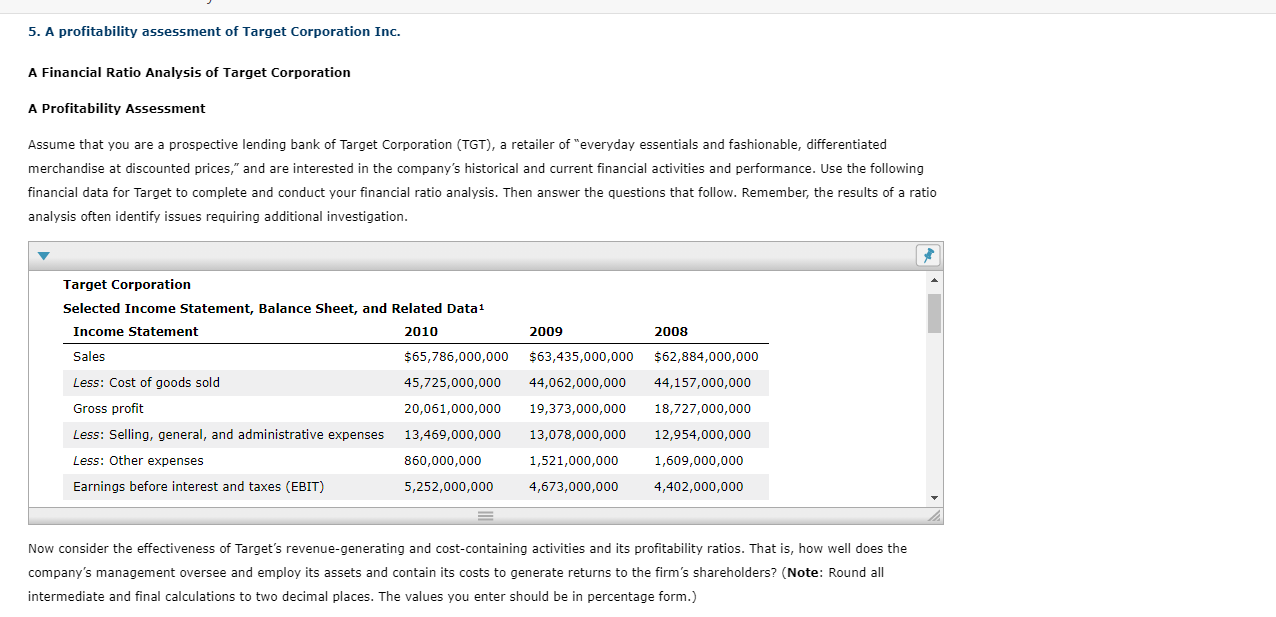


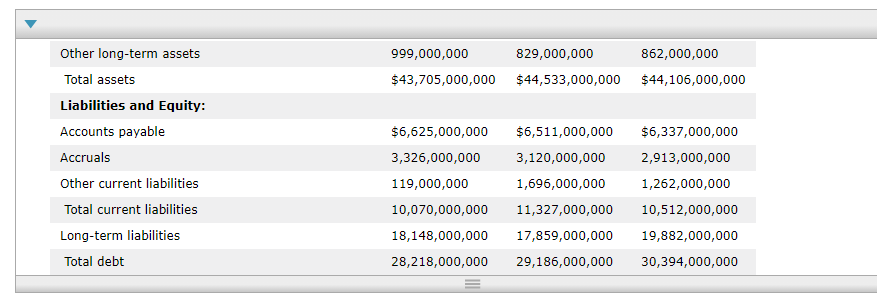
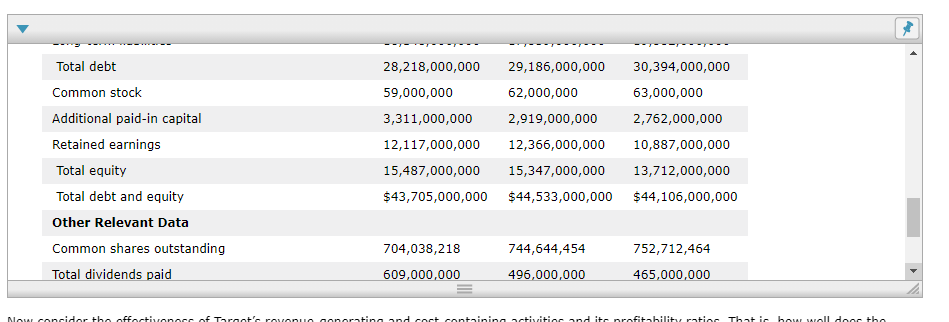

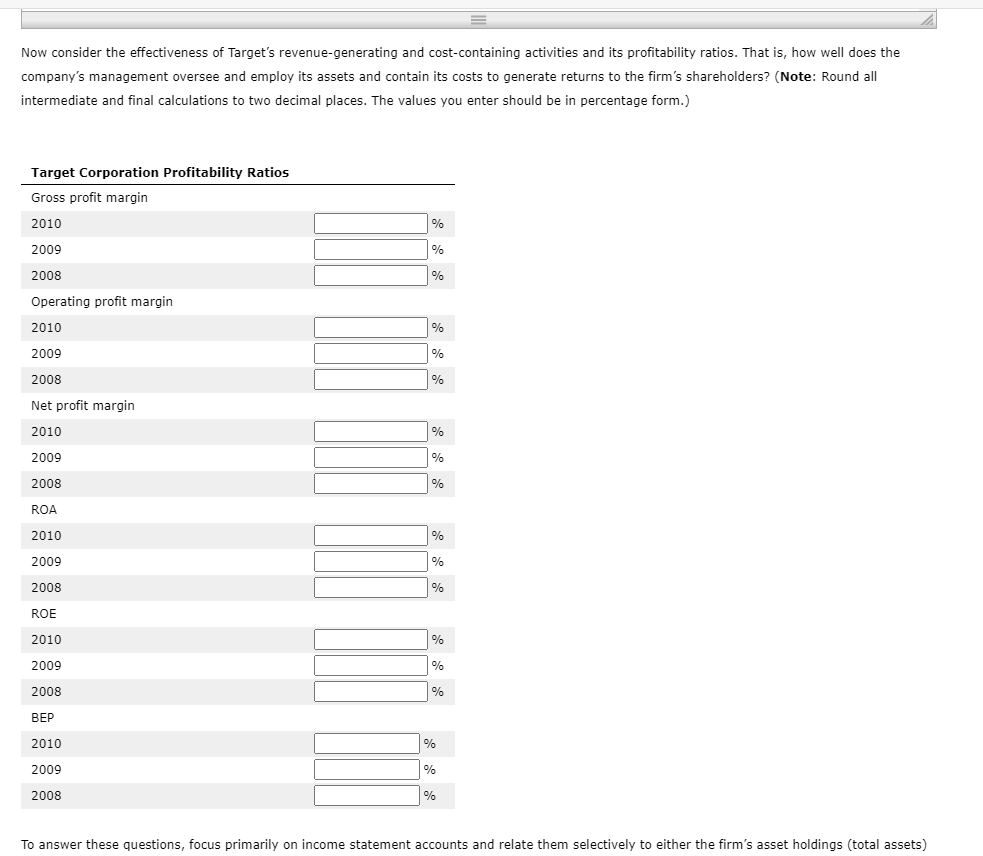
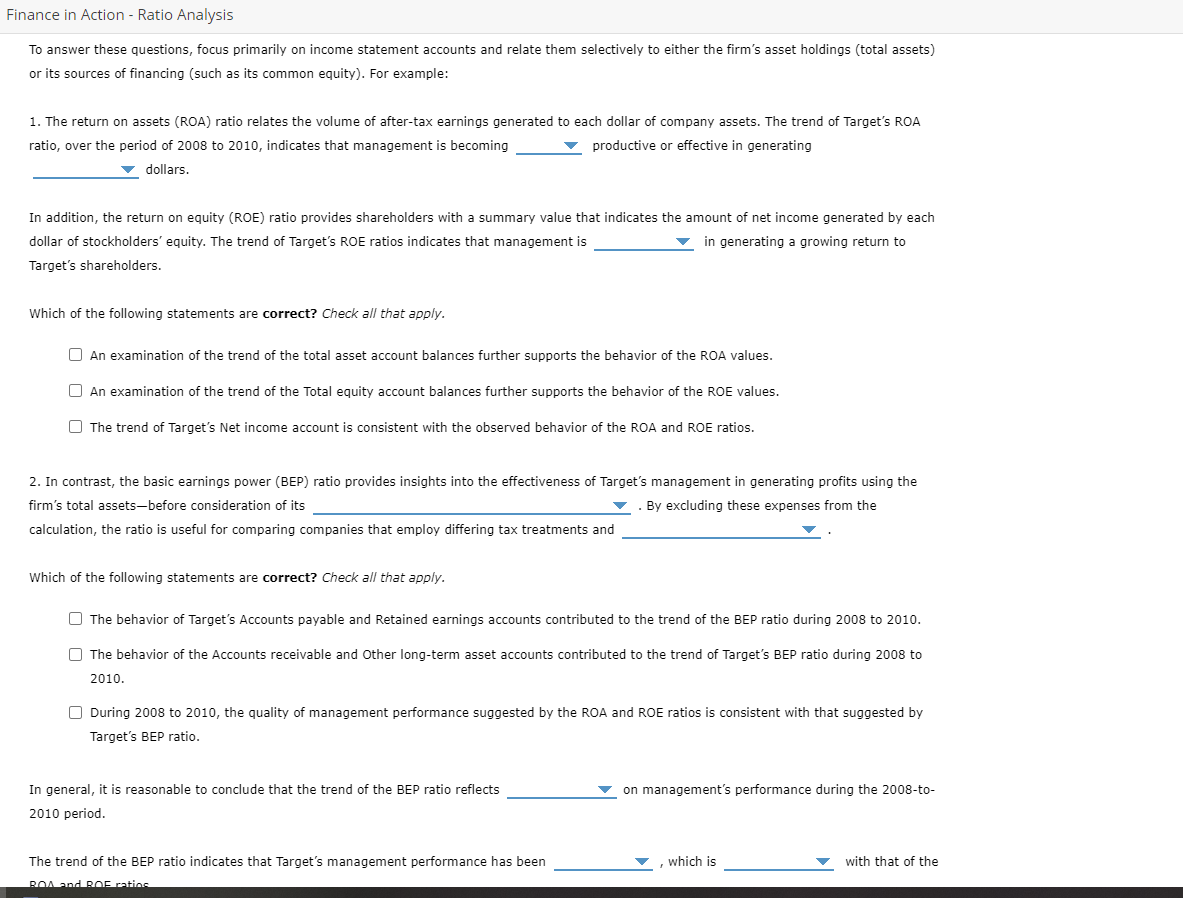
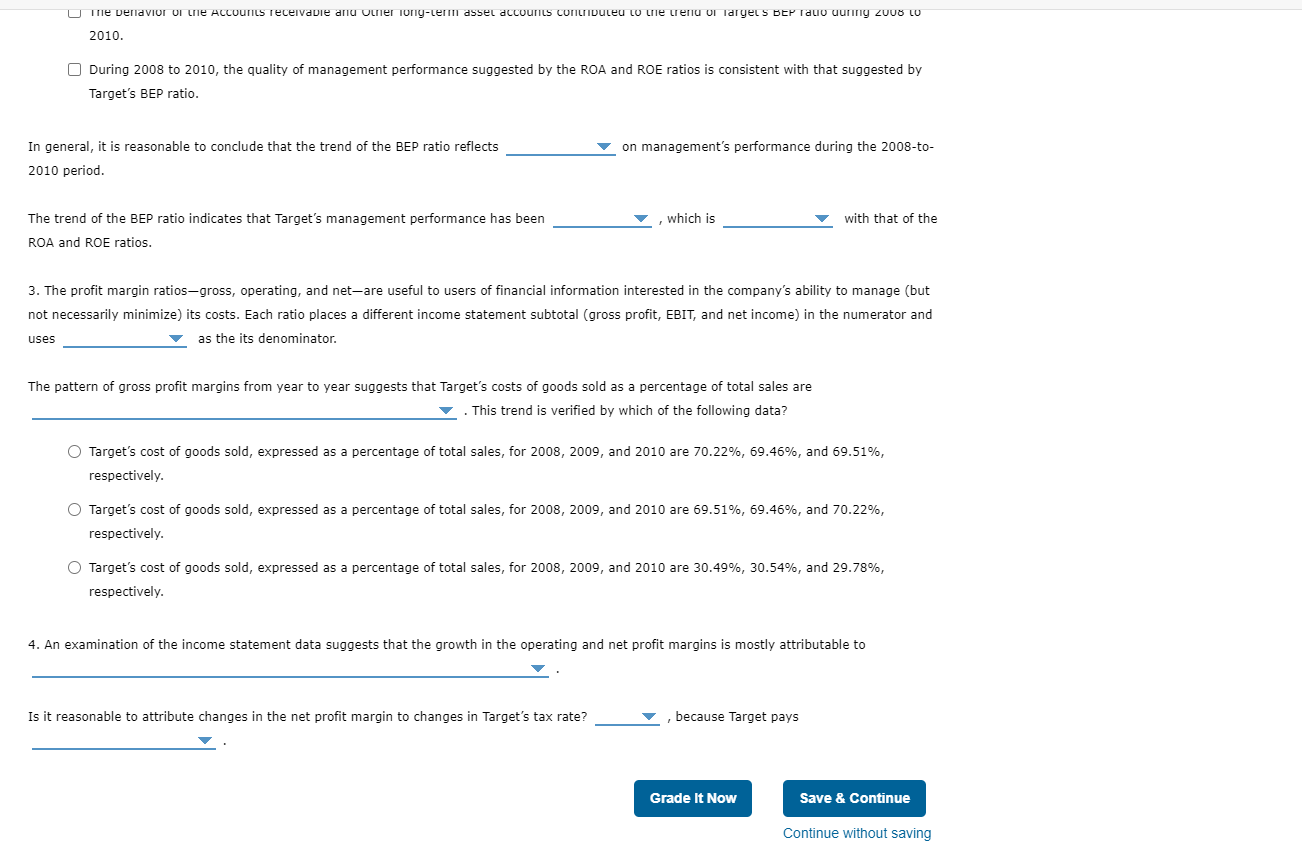
5. A profitability assessment of Target Corporation Inc. A Financial Ratio Analysis of Target Corporation A Profitability Assessment Assume that you are a prospective lending bank of Target Corporation (TGT), a retailer of "everyday essentials and fashionable, differentiated merchandise at discounted prices," and are interested in the company's historical and current financial activities and performance. Use the following financial data for Target to complete and conduct your financial ratio analysis. Then answer the questions that follow. Remember, the results of a ratio analysis often identify issues requiring additional investigation. Target Corporation Selected Income Statement, Balance Sheet, and Related Data1 Income Statement 2010 2009 2008 Sales $65,786,000,000 $63,435,000,000 $62,884,000,000 Less: Cost of goods sold 44,062,000,000 44,157,000,000 45,725,000,000 20,061,000,000 19,373,000,000 18,727,000,000 13,469,000,000 13,078,000,000 12,954,000,000 Gross profit Less: Selling, general, and administrative expenses Less: Other expenses Earnings before interest and taxes (EBIT) 860,000,000 1,521,000,000 1,609,000,000 5,252,000,000 4,673,000,000 4,402,000,000 Now consider the effectiveness of Target's revenue-generating and cost-containing activities and its profitability ratios. That is, how well does the company's management oversee and employ its assets and contain its costs to generate returns to the firm's shareholders? (Note: Round all intermediate and final calculations to two decimal places. The values you enter should be in percentage form.) 866,000,000 Less: Interest expense Earnings before taxes (EBT) Less: Taxes Net income Less: Common dividends paid Dividends per share Balance Sheet Data Assets: 757,000,000 4,495,000,000 1,575,000,000 $2,920,000,000 609,000,000 $0.87 801,000,000 3,872,000,000 1,384,000,000 $2,488,000,000 496,000,000 $0.67 3,536,000,000 1,322,000,000 $2,214,000,000 465,000,000 $0.62 2010 2009 2008 Cash and marketable securities $1,712,000,000 $2,200,000,000 $864,000,000 Balance Sheet Data Assets: 2010 2009 2008 Cash and marketable securities $2,200,000,000 $864,000,000 Receivables $1,712,000,000 6,153,000,000 7,596,000,000 8,084,000,000 Inventory 6,705,000,000 6,966,000,000 7,179,000,000 2,079,000,000 18,424,000,000 Other current assets 1,835,000,000 Total current assets 1,752,000,000 17,213,000,000 25,493,000,000 Net fixed assets 25,280,000,000 17,488,000,000 25,756,000,000 862,000,000 Other long-term assets 999,000,000 829,000,000 829,000,000 999,000,000 $43,705,000,000 862,000,000 $44,106,000,000 $44,533,000,000 Other long-term assets Total assets Liabilities and Equity: Accounts payable Accruals Other current liabilities Total current liabilities Long-term liabilities Total debt $6,625,000,000 3,326,000,000 119,000,000 10,070,000,000 18,148,000,000 28,218,000,000 $6,511,000,000 3,120,000,000 1,696,000,000 11,327,000,000 17,859,000,000 29,186,000,000 $6,337,000,000 2,913,000,000 1,262,000,000 10,512,000,000 19,882,000,000 30,394,000,000 Total debt 30,394,000,000 Common stock Additional paid-in capital Retained earnings Total equity Total debt and equity Other Relevant Data Common shares outstanding Total dividends paid 28,218,000,000 59,000,000 3,311,000,000 12,117,000,000 15,487,000,000 $43,705,000,000 29,186,000,000 62,000,000 2,919,000,000 12,366,000,000 15,347,000,000 $44,533,000,000 63,000,000 2,762,000,000 10,887,000,000 13,712,000,000 $44,106,000,000 704,038,218 744,644,454 752,712,464 609,000,000 496,000,000 465,000,000 Norconcider the effectiveneef Tarot'e rovnu onorating and coct containing activities and it profitabilitu potice that is bor all done the 704,038,218 752,712,464 Other Relevant Data Common shares outstanding Total dividends paid Market price per share 744,644,454 496,000,000 609,000,000 465,000,000 $54.35 $51.27 $31.20 Now consider the effectiveness of Target's revenue-generating and cost-containing activities and its profitability ratios. That is, how well does the company's management oversee and employ its assets and contain its costs to generate returns to the firm's shareholders? (Note: Round all intermediate and final calculations to two decimal places. The values you enter should be in percentage form.) Target Corporation Profitability Ratios Gross profit margin 2010 % 2009 % 2008 % Operating profit margin 2010 % 2009 % 2008 % Net profit margin 2010 % 2009 % 2008 % ROA 2010 % 2009 % 2008 % ROE 2010 % 2009 % 2008 % BEP 2010 % 2009 % 2008 % To answer these questions, focus primarily on income statement accounts and relate them selectively to either the firm's asset holdings (total assets) Finance in Action - Ratio Analysis To answer these questions, focus primarily on income statement accounts and relate them selectively to either the firm's asset holdings (total assets) or its sources of financing (such as its common equity). For example: 1. The return on assets (ROA) ratio relates the volume of after-tax earnings generated to each dollar of company assets. The trend of Target's ROA ratio, over the period of 2008 to 2010, indicates that management is becoming productive or effective in generating dollars. In addition, the return on equity (ROE) ratio provides shareholders with a summary value that indicates the amount of net income generated by each dollar of stockholders' equity. The trend of Target's ROE ratios indicates that management is in generating a growing return to Target's shareholders. Which of the following statements are correct? Check all that apply. An examination of the trend of the total asset account balances further supports the behavior of the ROA values. An examination of the trend of the Total equity account balances further supports the behavior of the ROE values. The trend of Target's Net income account is consistent with the observed behavior of the ROA and ROE ratios. 2. In contrast, the basic earnings power (BEP) ratio provides insights into the effectiveness of Target's management in generating profits using the firm's total assets-before consideration of its . By excluding these expenses from the calculation, the ratio is useful for comparing companies that employ differing tax treatments and Which of the following statements are correct? Check all that apply. The behavior of Target's Accounts payable and retained earnings accounts contributed to the trend of the BEP ratio during 2008 to 2010. The behavior of the Accounts receivable and Other long-term asset accounts contributed to the trend of Target's BEP ratio during 2008 to 2010. During 2008 to 2010, the quality of management performance suggested by the ROA and ROE ratios is consistent with that suggested by Target's BEP ratio. on management's performance during the 2008-to- In general, it is reasonable to conclude that the trend of the BEP ratio reflects 2010 period. which is with that of the The trend of the BEP ratio indicates that Target's management performance has been BOA and RAE ratio U me venavior of the Accounts receivable and other long-term asset accounts contributeu to me tenu di Taryel S BEP Tauo uury 2008 LO 2010. During 2008 to 2010, the quality of management performance suggested by the ROA and ROE ratios is consistent with that suggested by Target's BEP ratio. In general, it is reasonable to conclude that the trend of the BEP ratio reflects on management's performance during the 2008-to- 2010 period. which is with that of the The trend of the BEP ratio indicates that Target's management performance has been ROA and ROE ratios. 3. The profit margin ratios-gross, operating, and net-are useful to users of financial information interested in the company's ability to manage (but not necessarily minimize) its costs. Each ratio places a different income statement subtotal (gross profit, EBIT, and net income) in the numerator and uses as the its denominator. The pattern of gross profit margins from year to year suggests that Target's costs of goods sold as a percentage of total sales are . This trend is verified by which of the following data? O Target's cost of goods sold, expressed as a percentage of total sales, for 2008, 2009, and 2010 are 70.22%, 69.46%, and 69.51%, respectively. O Target's cost of goods sold, expressed as a percentage of total sales, for 2008, 2009, and 2010 are 69.51%, 69.46%, and 70.22%, respectively. O Target's cost of goods sold, expressed as a percentage of total sales, for 2008, 2009, and 2010 are 30.49%, 30.54%, and 29.78%, respectively. 4. An examination of the income statement data suggests that the growth in the operating and net profit margins is mostly attributable to Is it reasonable to attribute changes in the net profit margin to changes in Target's tax rate? because Target pays Grade It Now Save & Continue Continue without saving 5. A profitability assessment of Target Corporation Inc. A Financial Ratio Analysis of Target Corporation A Profitability Assessment Assume that you are a prospective lending bank of Target Corporation (TGT), a retailer of "everyday essentials and fashionable, differentiated merchandise at discounted prices," and are interested in the company's historical and current financial activities and performance. Use the following financial data for Target to complete and conduct your financial ratio analysis. Then answer the questions that follow. Remember, the results of a ratio analysis often identify issues requiring additional investigation. Target Corporation Selected Income Statement, Balance Sheet, and Related Data1 Income Statement 2010 2009 2008 Sales $65,786,000,000 $63,435,000,000 $62,884,000,000 Less: Cost of goods sold 44,062,000,000 44,157,000,000 45,725,000,000 20,061,000,000 19,373,000,000 18,727,000,000 13,469,000,000 13,078,000,000 12,954,000,000 Gross profit Less: Selling, general, and administrative expenses Less: Other expenses Earnings before interest and taxes (EBIT) 860,000,000 1,521,000,000 1,609,000,000 5,252,000,000 4,673,000,000 4,402,000,000 Now consider the effectiveness of Target's revenue-generating and cost-containing activities and its profitability ratios. That is, how well does the company's management oversee and employ its assets and contain its costs to generate returns to the firm's shareholders? (Note: Round all intermediate and final calculations to two decimal places. The values you enter should be in percentage form.) 866,000,000 Less: Interest expense Earnings before taxes (EBT) Less: Taxes Net income Less: Common dividends paid Dividends per share Balance Sheet Data Assets: 757,000,000 4,495,000,000 1,575,000,000 $2,920,000,000 609,000,000 $0.87 801,000,000 3,872,000,000 1,384,000,000 $2,488,000,000 496,000,000 $0.67 3,536,000,000 1,322,000,000 $2,214,000,000 465,000,000 $0.62 2010 2009 2008 Cash and marketable securities $1,712,000,000 $2,200,000,000 $864,000,000 Balance Sheet Data Assets: 2010 2009 2008 Cash and marketable securities $2,200,000,000 $864,000,000 Receivables $1,712,000,000 6,153,000,000 7,596,000,000 8,084,000,000 Inventory 6,705,000,000 6,966,000,000 7,179,000,000 2,079,000,000 18,424,000,000 Other current assets 1,835,000,000 Total current assets 1,752,000,000 17,213,000,000 25,493,000,000 Net fixed assets 25,280,000,000 17,488,000,000 25,756,000,000 862,000,000 Other long-term assets 999,000,000 829,000,000 829,000,000 999,000,000 $43,705,000,000 862,000,000 $44,106,000,000 $44,533,000,000 Other long-term assets Total assets Liabilities and Equity: Accounts payable Accruals Other current liabilities Total current liabilities Long-term liabilities Total debt $6,625,000,000 3,326,000,000 119,000,000 10,070,000,000 18,148,000,000 28,218,000,000 $6,511,000,000 3,120,000,000 1,696,000,000 11,327,000,000 17,859,000,000 29,186,000,000 $6,337,000,000 2,913,000,000 1,262,000,000 10,512,000,000 19,882,000,000 30,394,000,000 Total debt 30,394,000,000 Common stock Additional paid-in capital Retained earnings Total equity Total debt and equity Other Relevant Data Common shares outstanding Total dividends paid 28,218,000,000 59,000,000 3,311,000,000 12,117,000,000 15,487,000,000 $43,705,000,000 29,186,000,000 62,000,000 2,919,000,000 12,366,000,000 15,347,000,000 $44,533,000,000 63,000,000 2,762,000,000 10,887,000,000 13,712,000,000 $44,106,000,000 704,038,218 744,644,454 752,712,464 609,000,000 496,000,000 465,000,000 Norconcider the effectiveneef Tarot'e rovnu onorating and coct containing activities and it profitabilitu potice that is bor all done the 704,038,218 752,712,464 Other Relevant Data Common shares outstanding Total dividends paid Market price per share 744,644,454 496,000,000 609,000,000 465,000,000 $54.35 $51.27 $31.20 Now consider the effectiveness of Target's revenue-generating and cost-containing activities and its profitability ratios. That is, how well does the company's management oversee and employ its assets and contain its costs to generate returns to the firm's shareholders? (Note: Round all intermediate and final calculations to two decimal places. The values you enter should be in percentage form.) Target Corporation Profitability Ratios Gross profit margin 2010 % 2009 % 2008 % Operating profit margin 2010 % 2009 % 2008 % Net profit margin 2010 % 2009 % 2008 % ROA 2010 % 2009 % 2008 % ROE 2010 % 2009 % 2008 % BEP 2010 % 2009 % 2008 % To answer these questions, focus primarily on income statement accounts and relate them selectively to either the firm's asset holdings (total assets) Finance in Action - Ratio Analysis To answer these questions, focus primarily on income statement accounts and relate them selectively to either the firm's asset holdings (total assets) or its sources of financing (such as its common equity). For example: 1. The return on assets (ROA) ratio relates the volume of after-tax earnings generated to each dollar of company assets. The trend of Target's ROA ratio, over the period of 2008 to 2010, indicates that management is becoming productive or effective in generating dollars. In addition, the return on equity (ROE) ratio provides shareholders with a summary value that indicates the amount of net income generated by each dollar of stockholders' equity. The trend of Target's ROE ratios indicates that management is in generating a growing return to Target's shareholders. Which of the following statements are correct? Check all that apply. An examination of the trend of the total asset account balances further supports the behavior of the ROA values. An examination of the trend of the Total equity account balances further supports the behavior of the ROE values. The trend of Target's Net income account is consistent with the observed behavior of the ROA and ROE ratios. 2. In contrast, the basic earnings power (BEP) ratio provides insights into the effectiveness of Target's management in generating profits using the firm's total assets-before consideration of its . By excluding these expenses from the calculation, the ratio is useful for comparing companies that employ differing tax treatments and Which of the following statements are correct? Check all that apply. The behavior of Target's Accounts payable and retained earnings accounts contributed to the trend of the BEP ratio during 2008 to 2010. The behavior of the Accounts receivable and Other long-term asset accounts contributed to the trend of Target's BEP ratio during 2008 to 2010. During 2008 to 2010, the quality of management performance suggested by the ROA and ROE ratios is consistent with that suggested by Target's BEP ratio. on management's performance during the 2008-to- In general, it is reasonable to conclude that the trend of the BEP ratio reflects 2010 period. which is with that of the The trend of the BEP ratio indicates that Target's management performance has been BOA and RAE ratio U me venavior of the Accounts receivable and other long-term asset accounts contributeu to me tenu di Taryel S BEP Tauo uury 2008 LO 2010. During 2008 to 2010, the quality of management performance suggested by the ROA and ROE ratios is consistent with that suggested by Target's BEP ratio. In general, it is reasonable to conclude that the trend of the BEP ratio reflects on management's performance during the 2008-to- 2010 period. which is with that of the The trend of the BEP ratio indicates that Target's management performance has been ROA and ROE ratios. 3. The profit margin ratios-gross, operating, and net-are useful to users of financial information interested in the company's ability to manage (but not necessarily minimize) its costs. Each ratio places a different income statement subtotal (gross profit, EBIT, and net income) in the numerator and uses as the its denominator. The pattern of gross profit margins from year to year suggests that Target's costs of goods sold as a percentage of total sales are . This trend is verified by which of the following data? O Target's cost of goods sold, expressed as a percentage of total sales, for 2008, 2009, and 2010 are 70.22%, 69.46%, and 69.51%, respectively. O Target's cost of goods sold, expressed as a percentage of total sales, for 2008, 2009, and 2010 are 69.51%, 69.46%, and 70.22%, respectively. O Target's cost of goods sold, expressed as a percentage of total sales, for 2008, 2009, and 2010 are 30.49%, 30.54%, and 29.78%, respectively. 4. An examination of the income statement data suggests that the growth in the operating and net profit margins is mostly attributable to Is it reasonable to attribute changes in the net profit margin to changes in Target's tax rate? because Target pays Grade It Now Save & Continue Continue without saving


