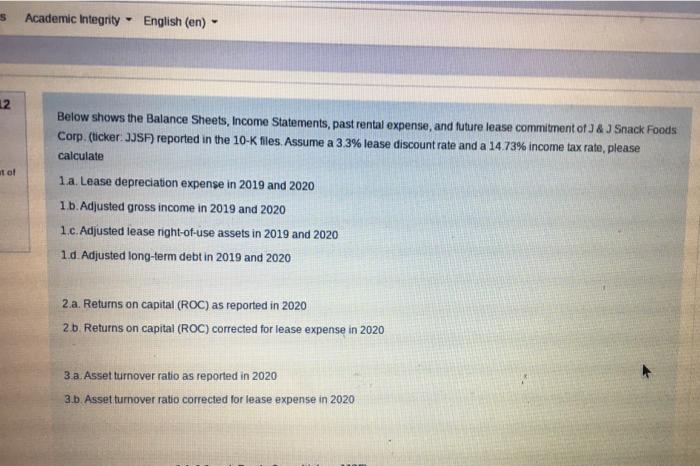
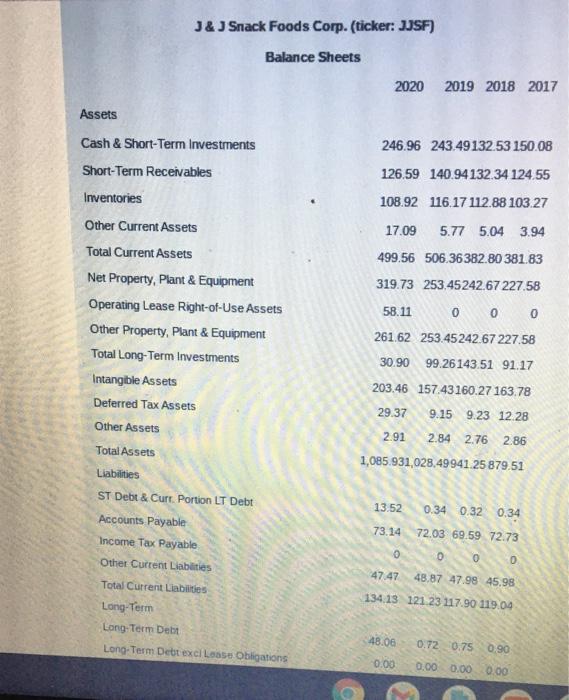
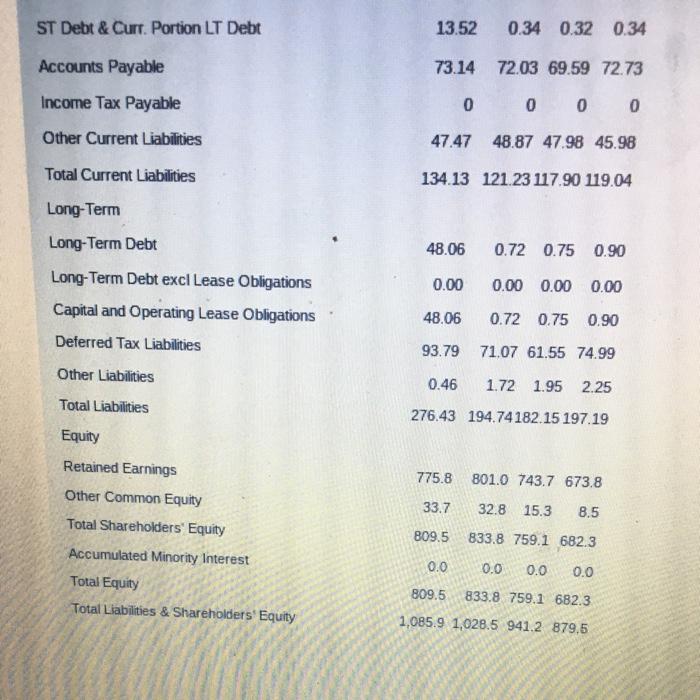
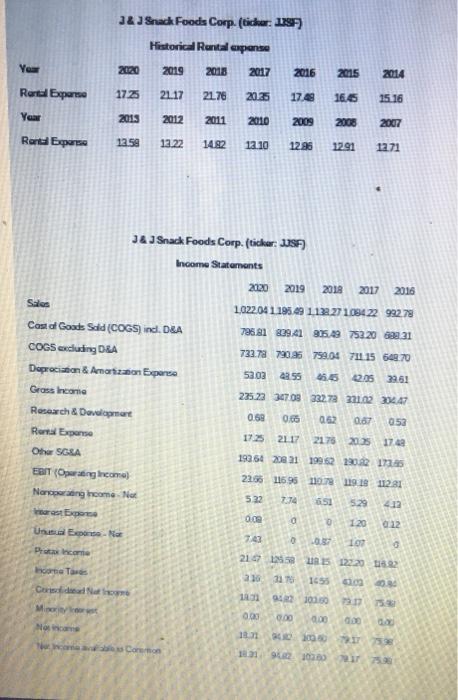
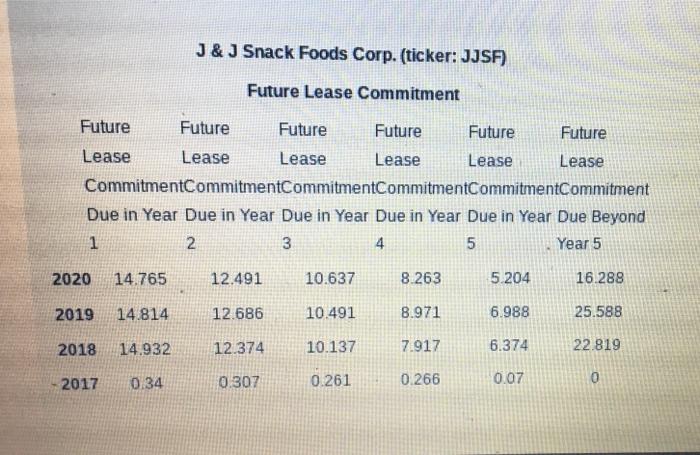
5 Academic Integrity - English (en) V 12 to Below shows the Balance Sheets, Income Statements, past rental expense, and future lease commitment of J & J Snack Foods Corp. (ticker: JUSF) reported in the 10-K files. Assume a 3.3% lease discount rate and a 14.73% income tax rate, please calculate 1a. Lease depreciation expense in 2019 and 2020 1b. Adjusted gross income in 2019 and 2020 1cAdjusted lease right-of-use assets in 2019 and 2020 1.0. Adjusted long-term debt in 2019 and 2020 2.a. Returns on capital (ROC) as reported in 2020 2b Returns on capital (ROC) corrected for lease expense in 2020 3.a Asset turnover ratio as reported in 2020 3.b Asset turnover ratio corrected for lease expense in 2020 J & J Snack Foods Corp. (ticker: JJSF) Balance Sheets 2020 2019 2018 2017 Assets 246.96 243.49132.53 150.08 126.59 140.94132.34 124,55 108.92 116.17 112.88 103.27 17.09 5.77 5.04 3.94 Cash & Short-Term Investments Short-Term Receivables Inventories Other Current Assets Total Current Assets Net Property, Plant & Equipment Operating Lease Right-of-Use Assets Other Property, Plant & Equipment Total Long-Term Investments "Intangible Assets Deferred Tax Assets Other Assets Total Assets 499.56 506.36382.80 381.83 319.73 253,45242.67 227.58 58.11 0 0 0 261.62 253.45242.67 227.58 30.90 99.26143.51 91.17 203.46 157.43160.27 163.78 29.37 9.15 9.23 12.28 2.91 2.84 2.76 2.86 1,085.931,028,49941.25 879.51 Liabilities 13.52 0.34 0.32 0.34 ST Debt & Curr. Portion LT Debt Accounts Payable Income Tax Payable Other Current Liabilities 73.14 72.03 69.59 72.73 0 0 Total Current Liabilities 47.47 48.87 47.98 45.98 134 13 121 23 217.90 119.04 Long-Term Long Term Debt Long-Term Debt excl Lease Obligations 48.06 0.72 0.75 0.90 0.00 0.00 0.00 0.00 ST Debt & Curr. Portion LT Debt 13.52 0.34 0.32 0.34 Accounts Payable 73.14 72.03 69.59 72.73 Income Tax Payable 0 0 0 0 Other Current Liabilities 47.47 48.87 47.98 45.98 Total Current Liabilities 134.13 121.23 117.90 119.04 Long-Term Long-Term Debt 48.06 0.72 0.75 0.90 0.00 0.00 0.00 0.00 Long-Term Debt excl Lease Obligations Capital and Operating Lease Obligations Deferred Tax Liabilities 48.06 0.72 0.75 0.90 93.79 71.07 61.55 74.99 Other Liabilities 0.46 1.72 1.95 2.25 Total Liabilities 276.43 194.74182.15 197.19 Equity 775.8 801.0743.7 673.8 33.7 32.8 15.3 8.5 Retained Earnings Other Common Equity Total Shareholders' Equity Accumulated Minority Interest Total Equity Total Liabilities & Shareholders' Equity 809.5 833.8 759.1 682.3 0.0 0.0 0.0 0.0 809.5 833.8 759.1 682.3 1,085.9 1,028.5 9412 879.5 J&J Snack Foods Corp. (ticker: 1995) Historical Rental expense Year 2020 2019 2018 2017 2016 2015 2014 Rural Expre 1725 2117 21.76 2025 17.49 16.6 15.16 Year 2015 2012 2011 2010 2009 2008 2007 Rand Exporne 12.59 12.22 1492 12.10 1296 1291 1271 JA Snack Foods Corp. (ticker: JSF) Income Statements 2120 2019 2018 2017 2016 1,022,04 1 195.49 1122.27 1.0842299278 786 81 829.4 915.09 752.20 21 732.78 790.86 759.04 71115 648.70 EDES 4355 45.5 02.05 2961 225.2334703 33272 33103 204.47 Sales Castel Goods Said (COGS) ind. DLA COGS excluding D&A Doprociston & Amortizzaton parte Grass Income Research & Development Retal Euro Other SGLA ERIT (Operating comes Nanging home. Nuk warto 0.58 0.00 0.07 0.52 17.25 21.17 2175 2075 17.49 192 66 2921 199.62 220 22 17245 2256 11596 118 119 19 112.81 CES 774 IS 5.29 412 0.00 0 0 1 20 022 Unse 7,43 0 07 100 Puta come 210 US 12.2013 23 2015 1655 Income Taxe Casa Nato M 1942 1000 75 0.00 0.00 Nos 18. 05 Connon 101 10000 J & J Snack Foods Corp. (ticker: JJSF) Future Lease Commitment Future Future Future Future Future Future Lease Lease Lease Lease Lease Lease Commitment Commitment Commitment CommitmentCommitmentCommitment Due in Year Due in Year Due in Year Due in Year Due in Year Due Beyond 1 2 3 4 5 Year 5 2020 14.765 12.491 10.637 8.263 5.204 16.288 2019 14.814 12.686 10.491 8.971 6.988 25.588 2018 14.932 12.374 10.137 7.917 6.374 22.819 2017 0.34 0.307 0.261 0.266 0.07 5 Academic Integrity - English (en) V 12 to Below shows the Balance Sheets, Income Statements, past rental expense, and future lease commitment of J & J Snack Foods Corp. (ticker: JUSF) reported in the 10-K files. Assume a 3.3% lease discount rate and a 14.73% income tax rate, please calculate 1a. Lease depreciation expense in 2019 and 2020 1b. Adjusted gross income in 2019 and 2020 1cAdjusted lease right-of-use assets in 2019 and 2020 1.0. Adjusted long-term debt in 2019 and 2020 2.a. Returns on capital (ROC) as reported in 2020 2b Returns on capital (ROC) corrected for lease expense in 2020 3.a Asset turnover ratio as reported in 2020 3.b Asset turnover ratio corrected for lease expense in 2020 J & J Snack Foods Corp. (ticker: JJSF) Balance Sheets 2020 2019 2018 2017 Assets 246.96 243.49132.53 150.08 126.59 140.94132.34 124,55 108.92 116.17 112.88 103.27 17.09 5.77 5.04 3.94 Cash & Short-Term Investments Short-Term Receivables Inventories Other Current Assets Total Current Assets Net Property, Plant & Equipment Operating Lease Right-of-Use Assets Other Property, Plant & Equipment Total Long-Term Investments "Intangible Assets Deferred Tax Assets Other Assets Total Assets 499.56 506.36382.80 381.83 319.73 253,45242.67 227.58 58.11 0 0 0 261.62 253.45242.67 227.58 30.90 99.26143.51 91.17 203.46 157.43160.27 163.78 29.37 9.15 9.23 12.28 2.91 2.84 2.76 2.86 1,085.931,028,49941.25 879.51 Liabilities 13.52 0.34 0.32 0.34 ST Debt & Curr. Portion LT Debt Accounts Payable Income Tax Payable Other Current Liabilities 73.14 72.03 69.59 72.73 0 0 Total Current Liabilities 47.47 48.87 47.98 45.98 134 13 121 23 217.90 119.04 Long-Term Long Term Debt Long-Term Debt excl Lease Obligations 48.06 0.72 0.75 0.90 0.00 0.00 0.00 0.00 ST Debt & Curr. Portion LT Debt 13.52 0.34 0.32 0.34 Accounts Payable 73.14 72.03 69.59 72.73 Income Tax Payable 0 0 0 0 Other Current Liabilities 47.47 48.87 47.98 45.98 Total Current Liabilities 134.13 121.23 117.90 119.04 Long-Term Long-Term Debt 48.06 0.72 0.75 0.90 0.00 0.00 0.00 0.00 Long-Term Debt excl Lease Obligations Capital and Operating Lease Obligations Deferred Tax Liabilities 48.06 0.72 0.75 0.90 93.79 71.07 61.55 74.99 Other Liabilities 0.46 1.72 1.95 2.25 Total Liabilities 276.43 194.74182.15 197.19 Equity 775.8 801.0743.7 673.8 33.7 32.8 15.3 8.5 Retained Earnings Other Common Equity Total Shareholders' Equity Accumulated Minority Interest Total Equity Total Liabilities & Shareholders' Equity 809.5 833.8 759.1 682.3 0.0 0.0 0.0 0.0 809.5 833.8 759.1 682.3 1,085.9 1,028.5 9412 879.5 J&J Snack Foods Corp. (ticker: 1995) Historical Rental expense Year 2020 2019 2018 2017 2016 2015 2014 Rural Expre 1725 2117 21.76 2025 17.49 16.6 15.16 Year 2015 2012 2011 2010 2009 2008 2007 Rand Exporne 12.59 12.22 1492 12.10 1296 1291 1271 JA Snack Foods Corp. (ticker: JSF) Income Statements 2120 2019 2018 2017 2016 1,022,04 1 195.49 1122.27 1.0842299278 786 81 829.4 915.09 752.20 21 732.78 790.86 759.04 71115 648.70 EDES 4355 45.5 02.05 2961 225.2334703 33272 33103 204.47 Sales Castel Goods Said (COGS) ind. DLA COGS excluding D&A Doprociston & Amortizzaton parte Grass Income Research & Development Retal Euro Other SGLA ERIT (Operating comes Nanging home. Nuk warto 0.58 0.00 0.07 0.52 17.25 21.17 2175 2075 17.49 192 66 2921 199.62 220 22 17245 2256 11596 118 119 19 112.81 CES 774 IS 5.29 412 0.00 0 0 1 20 022 Unse 7,43 0 07 100 Puta come 210 US 12.2013 23 2015 1655 Income Taxe Casa Nato M 1942 1000 75 0.00 0.00 Nos 18. 05 Connon 101 10000 J & J Snack Foods Corp. (ticker: JJSF) Future Lease Commitment Future Future Future Future Future Future Lease Lease Lease Lease Lease Lease Commitment Commitment Commitment CommitmentCommitmentCommitment Due in Year Due in Year Due in Year Due in Year Due in Year Due Beyond 1 2 3 4 5 Year 5 2020 14.765 12.491 10.637 8.263 5.204 16.288 2019 14.814 12.686 10.491 8.971 6.988 25.588 2018 14.932 12.374 10.137 7.917 6.374 22.819 2017 0.34 0.307 0.261 0.266 0.07