Answered step by step
Verified Expert Solution
Question
1 Approved Answer
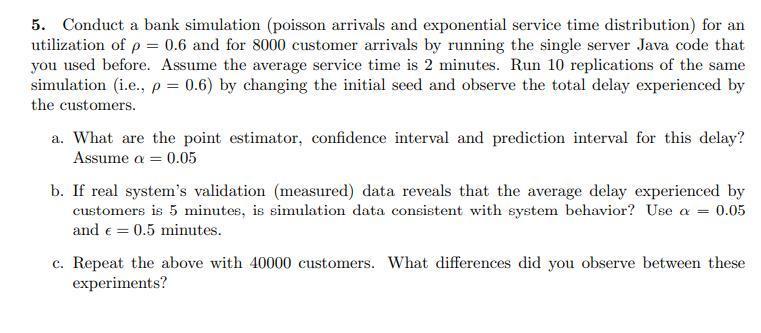
5. Conduct a bank simulation (poisson arrivals and exponential service time distribution) for an utilization of p = 0.6 and for 8000 customer arrivals

5. Conduct a bank simulation (poisson arrivals and exponential service time distribution) for an utilization of p = 0.6 and for 8000 customer arrivals by running the single server Java code that you used before. Assume the average service time is 2 minutes. Run 10 replications of the same simulation (i.e., p= 0.6) by changing the initial seed and observe the total delay experienced by the customers. a. What are the point estimator, confidence interval and prediction interval for this delay? Assume a 0.05 b. If real system's validation (measured) data reveals that the average delay experienced by customers is 5 minutes, is simulation data consistent with system behavior? Use a and = 0.5 minutes. = 0.05 c. Repeat the above with 40000 customers. What differences did you observe between these experiments?
Step by Step Solution
★★★★★
3.43 Rating (156 Votes )
There are 3 Steps involved in it
Step: 1
a To find the point estimator confidence interval and prediction interval for the delay experienced by customers well simulate the system for 10 replications with 8000 customer arrivals each using dif...
Get Instant Access to Expert-Tailored Solutions
See step-by-step solutions with expert insights and AI powered tools for academic success
Step: 2

Step: 3

Ace Your Homework with AI
Get the answers you need in no time with our AI-driven, step-by-step assistance
Get Started


