Answered step by step
Verified Expert Solution
Link Copied!

Question

1 Approved Answer

5. Given the following table, fill in the table, and graph the cost curves. Output (Q)/day Total Variable costs ($) Total costs (TC) ($) Marginal
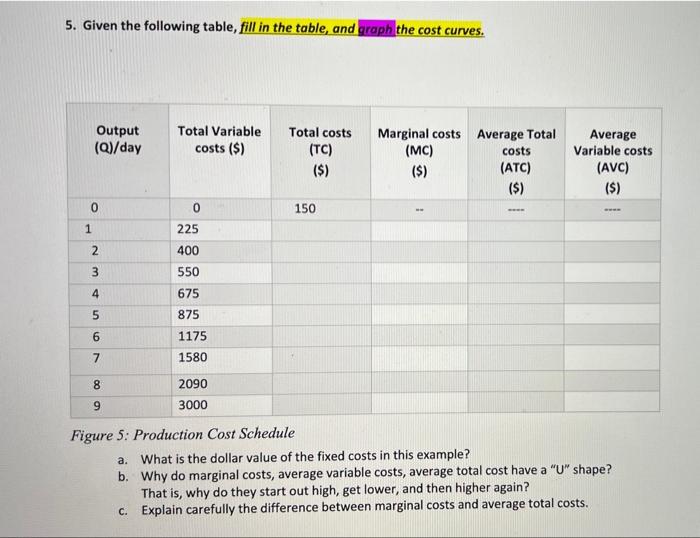
image text in transcribed
5. Given the following table, fill in the table, and graph the cost curves. Output (Q)/day Total Variable costs ($) Total costs (TC) ($) Marginal costs Average Total (MC) costs ($) (ATC) ($) Average Variable costs (AVC) ($) 0 150 1 225 2 400 3 550 4 675 875 5 6 1175 1580 7 7 8 2090 9 3000 a. Figure 5: Production Cost Schedule What is the dollar value of the fixed costs in this example? b. Why do marginal costs, average variable costs, average total cost have a "U" shape? That is, why do they start out high, get lower, and then higher again? c. Explain carefully the difference between marginal costs and average total costs

Step by Step Solution

There are 3 Steps involved in it

Step: 1

blur-text-image

Get Instant Access to Expert-Tailored Solutions

See step-by-step solutions with expert insights and AI powered tools for academic success

Step: 2

blur-text-image_2

Step: 3

blur-text-image_3

Ace Your Homework with AI

Get the answers you need in no time with our AI-driven, step-by-step assistance

Get Started

Recommended Textbook for

Financial Markets And Institutions

Authors: Anthony Saunders, Marcia Cornett

7th Edition

1259919714, 978-1259919718

More Books

Students also viewed these Finance questions