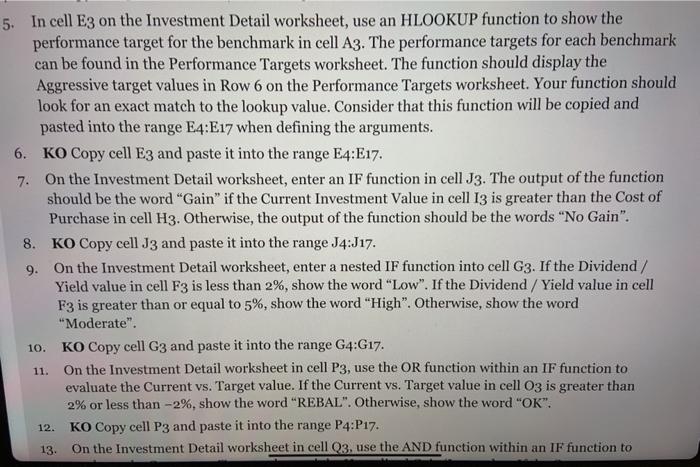
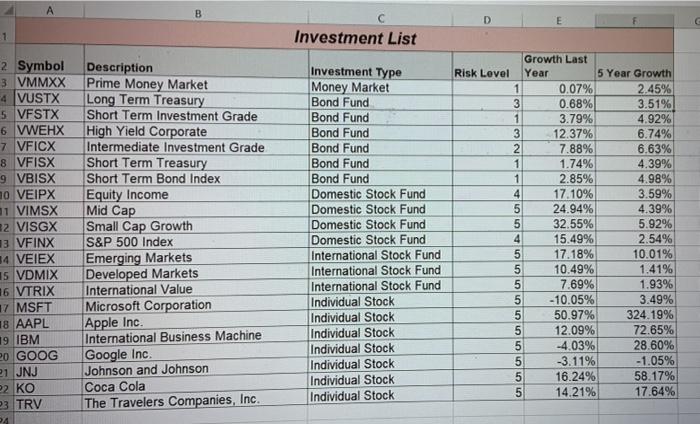
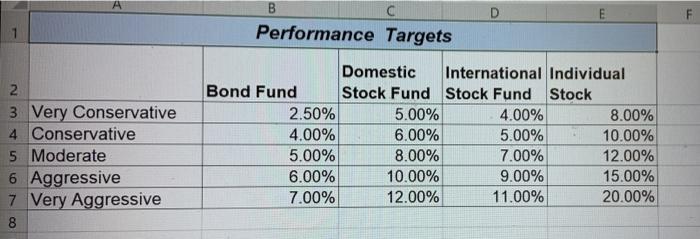
5. In cell Eg on the Investment Detail worksheet, use an HLOOKUP function to show the performance target for the benchmark in cell A3. The performance targets for each benchmark can be found in the Performance Targets worksheet. The function should display the Aggressive target values in Row 6 on the Performance Targets worksheet. Your function should look for an exact match to the lookup value. Consider that this function will be copied and pasted into the range E4:E17 when defining the arguments. 6. KO Copy cell E3 and paste it into the range E4:E17. 7. On the Investment Detail worksheet, enter an IF function in cell J3. The output of the function should be the word Gain" if the Current Investment Value in cell 13 is greater than the Cost of Purchase in cell H3. Otherwise, the output of the function should be the words "No Gain". 8. KO Copy cell J3 and paste it into the range J4:J17. 9. On the Investment Detail worksheet, enter a nested IF function into cell G3. If the Dividend / Yield value in cell F3 is less than 2%, show the word "Low". If the Dividend / Yield value in cell F3 is greater than or equal to 5%, show the word "High". Otherwise, show the word "Moderate". KO Copy cell G3 and paste it into the range G4:G17. On the Investment Detail worksheet in cell P3, use the OR function within an IF function to evaluate the Current vs. Target value. If the Current vs. Target value in cell O3 is greater than 2% or less than -2%, show the word "REBAL". Otherwise, show the word "OK". KO Copy cell P3 and paste it into the range P4:P17. On the Investment Detail worksheet in cell Q3, use the AND function within an IF function to 10. 11. 12. 13 D G Investment Portfolio 75% Investment Type Bybel Descroton Bond Fund VFICX Intermediate Investment Grade Bond Fund VESTX Short Term Investment Grade Bond Fund WWEHX High Yield Corporate Bond Fund VUSTX Long Term Treasury International Stock Fund VDMIX Developed Markets # Domestic Stock Fund MEX Equity income 1 Domestic Stock Fund VISGX Small Cap Growth Domestic Stock Fund VIMSX Mid Cap 11 International Stock Fund VTRIX International Value International Stock Fund VEIEX Emerging Markets Individual Stock TRV The Travelers Companies, the 1 Individual Stock NJ Johnson and Johnson 15 Individual Stoch KO Coca Cola Individual Stock MSET Microson Corporation 17 Individual Stock IBM International Business Machine Growth Performance Dividend Yield Last Yeu Targets Y Strength 7 88 4804 3.79% 32046 1237 7 20% 0.68% 400 10 49% 2.60% 17410 2.50% 32 55% 0308 24 94% 100% 7.69 2.OON 17.10 1401 14 21% 2409 3.114 3.00 18.24 2.80% -10.05% 2.50 12.09% 160N $ 117,625 Current Coster Investment Purchase ndicho $ 7.110 S 8,015 $ 8010 8 877 $ 3.1455 3956 $ 5.500 5 5628 $73403 5958 $ 11 6755 11 302 $ 48335 5,958 $ 58035 5.644 $5700 8.007 $ 39353 8,013 $ 5.7213 9.216 $7.995 11871 $ 93605 9957 $ 21025 2017 $ 6570 S 11.938 Current Target Und Parent Percent of Percent of Curre Cainossaints Port Partie 5 1097 23.85 75% 10 ON 5 867 1082 100% 811 25 7o 34 10.0% 120 220 4.8% 10 ON -5 $(1.3823 -18.82% 51 70 - $ (373) -3 20 50% 5 1.125 23 28% 51 SO 41 074 40 3.0 $ 2.000 50.8195 70' . $ 2,078 35 015 58 $ 3405 61 09 7. 50% 2 52676 459 9.9 50 $ $89 028 8.54 50 $ (14) -0079 50 $5.382 8153 10.11 50 A B D Investment List 1 2 Symbol 3 VMMXX 4 VUSTX 5 VFSTX 6 VWEHX 7 VFICX 8 VFISX 9 VBISX 0 VEIPX 1 VIMSX 32 VISGX 13 VFINX 4 VEIEX 15 VDMIX 16 VTRIX 17 MSFT 18 AAPL 19 IBM 20 GOOG 21 JNJ 2 KO P3 TRV 4 Description Prime Money Market Long Term Treasury Short Term Investment Grade High Yield Corporate Intermediate Investment Grade Short Term Treasury Short Term Bond Index Equity Income Mid Cap Small Cap Growth S&P 500 Index Emerging Markets Developed Markets International Value Microsoft Corporation Apple Inc. International Business Machine Google Inc. Johnson and Johnson Coca Cola The Travelers Companies, Inc. Investment Type Money Market Bond Fund Bond Fund Bond Fund Bond Fund Bond Fund Bond Fund Domestic Stock Fund Domestic Stock Fund Domestic Stock Fund Domestic Stock Fund International Stock Fund International Stock Fund International Stock Fund Individual Stock Individual Stock Individual Stock Individual Stock Individual Stock Individual Stock Individual Stock Growth Last Risk Lovel Year 5 Year Growth 1 0.07% 2.45% 3 0.68% 3.51% 1 3.79% 4.92% 3 12.37% 6.74% 2 7.88% 6.63% 1 1.74% 4.39% 1 2.85% 4.98% 4 17.10% 3.59% 5 24.94% 4.39% 5 32.55% 5.92% 4 15.49% 2.54% 5 17.18% 10.01% 5 10.49% 1.41% 5 7.69% 1.93% 5 -10.05% 3.49% 5 50.97% 324.19% 5 12.09% 72.65% 5 -4.03% 28.60% 5 -3.11% -1.05% 5 16.24% 58.17% 5 14.21% 17.64% A D E B Performance Targets 2 3 Very Conservative 4 Conservative 5 Moderate 6 Aggressive 7 Very Aggressive 8 Domestic International Individual Bond Fund Stock Fund Stock Fund Stock 2.50% 5.00% 4.00% 8.00% 4.00% 6.00% 5.00% 10.00% 5.00% 8.00% 7.00% 12.00% 6.00% 10.00% 9.00% 15.00% 7.00% 12.00% 11.00% 20.00%


