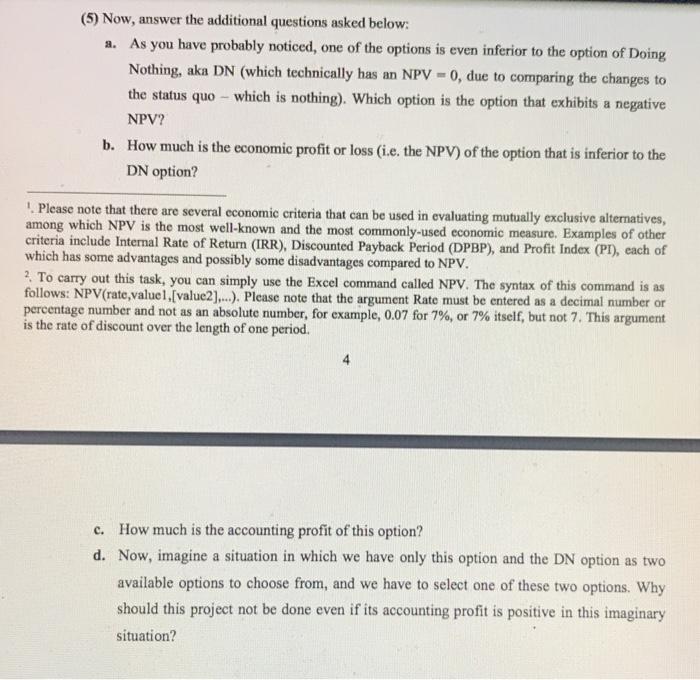
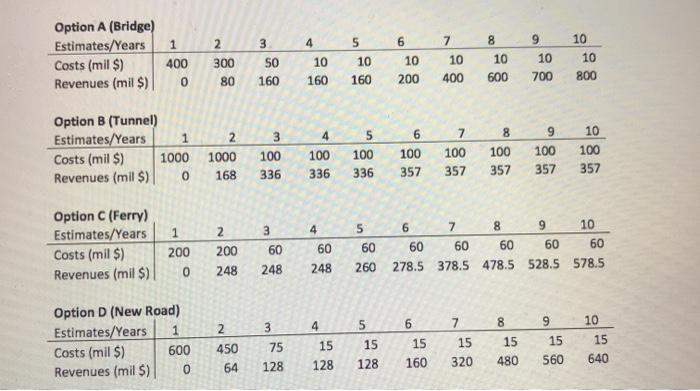
(5) Now, answer the additional questions asked below: 2. As you have probably noticed, one of the options is even inferior to the option of Doing Nothing, aka DN (which technically has an NPV = 0, due to comparing the changes to the status quo - which is nothing). Which option is the option that exhibits a negative NPV? b. How much is the economic profit or loss (i.e. the NPV) of the option that is inferior to the DN option? Please note that there are several economic criteria that can be used in evaluating mutually exclusive alternatives, among which NPV is the most well-known and the most commonly-used economic measure. Examples of other criteria include Internal Rate of Return (IRR), Discounted Payback Period (DPBP), and Profit Index (PT), each of which has some advantages and possibly some disadvantages compared to NPV. 2. To carry out this task, you can simply use the Excel command called NPV. The syntax of this command is as follows: NPV(rate, valuel, (value2]....). Please note that the argument Rate must be entered as a decimal number or percentage number and not as an absolute number, for example, 0.07 for 7%, or 7% itself, but not 7. This argument is the rate of discount over the length of one period. c. How much is the accounting profit of this option? d. Now, imagine a situation in which we have only this option and the DN option as two available options to choose from, and we have to select one of these two options. Why should this project not be done even if its accounting profit is positive in this imaginary situation? 3 4 5 6 8 10 Option A (Bridge) Estimates/Years Costs (mil $) Revenues (mil $) 1 400 0 2 300 80 50 10 10 10 160 7 10 400 10 200 9 10 700 10 600 160 160 800 4 5 6 7 Option B (Tunnel) Estimates/Years 1 Costs (mil $) 1000 Revenues (mil S) 0 2 1000 168 3 100 336 100 336 100 336 100 357 100 357 8 100 357 9 100 357 10 100 357 5 3 6 8 Option C (Ferry) Estimates/Years Costs (mil $) Revenues (mil $) 2 200 248 1 200 0 4 60 60 60 248 6 7 9 10 60 60 60 60 60 278.5 378.5 478.5 528.5 578.5 248 260 4 6 3 7 8 9 10 Option D (New Road) Estimates/Years 1 Costs (mil S) 600 Revenues (mil S) 0 2 450 64 15 15 75 5 15 128 15 160 15 320 15 560 15 640 128 480 128 (5) Now, answer the additional questions asked below: 2. As you have probably noticed, one of the options is even inferior to the option of Doing Nothing, aka DN (which technically has an NPV = 0, due to comparing the changes to the status quo - which is nothing). Which option is the option that exhibits a negative NPV? b. How much is the economic profit or loss (i.e. the NPV) of the option that is inferior to the DN option? Please note that there are several economic criteria that can be used in evaluating mutually exclusive alternatives, among which NPV is the most well-known and the most commonly-used economic measure. Examples of other criteria include Internal Rate of Return (IRR), Discounted Payback Period (DPBP), and Profit Index (PT), each of which has some advantages and possibly some disadvantages compared to NPV. 2. To carry out this task, you can simply use the Excel command called NPV. The syntax of this command is as follows: NPV(rate, valuel, (value2]....). Please note that the argument Rate must be entered as a decimal number or percentage number and not as an absolute number, for example, 0.07 for 7%, or 7% itself, but not 7. This argument is the rate of discount over the length of one period. c. How much is the accounting profit of this option? d. Now, imagine a situation in which we have only this option and the DN option as two available options to choose from, and we have to select one of these two options. Why should this project not be done even if its accounting profit is positive in this imaginary situation? 3 4 5 6 8 10 Option A (Bridge) Estimates/Years Costs (mil $) Revenues (mil $) 1 400 0 2 300 80 50 10 10 10 160 7 10 400 10 200 9 10 700 10 600 160 160 800 4 5 6 7 Option B (Tunnel) Estimates/Years 1 Costs (mil $) 1000 Revenues (mil S) 0 2 1000 168 3 100 336 100 336 100 336 100 357 100 357 8 100 357 9 100 357 10 100 357 5 3 6 8 Option C (Ferry) Estimates/Years Costs (mil $) Revenues (mil $) 2 200 248 1 200 0 4 60 60 60 248 6 7 9 10 60 60 60 60 60 278.5 378.5 478.5 528.5 578.5 248 260 4 6 3 7 8 9 10 Option D (New Road) Estimates/Years 1 Costs (mil S) 600 Revenues (mil S) 0 2 450 64 15 15 75 5 15 128 15 160 15 320 15 560 15 640 128 480 128