

Answered step by step
Verified Expert Solution
Question
1 Approved Answer
5. Part 2: Torsion testing The aim of the torsion test is to find the shear modulus, yield and ultimate shear strength for the
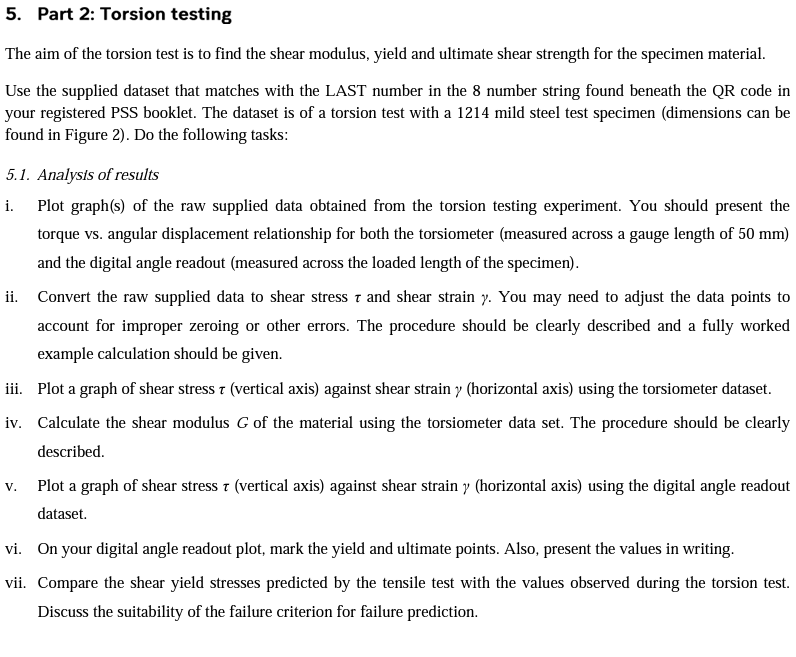
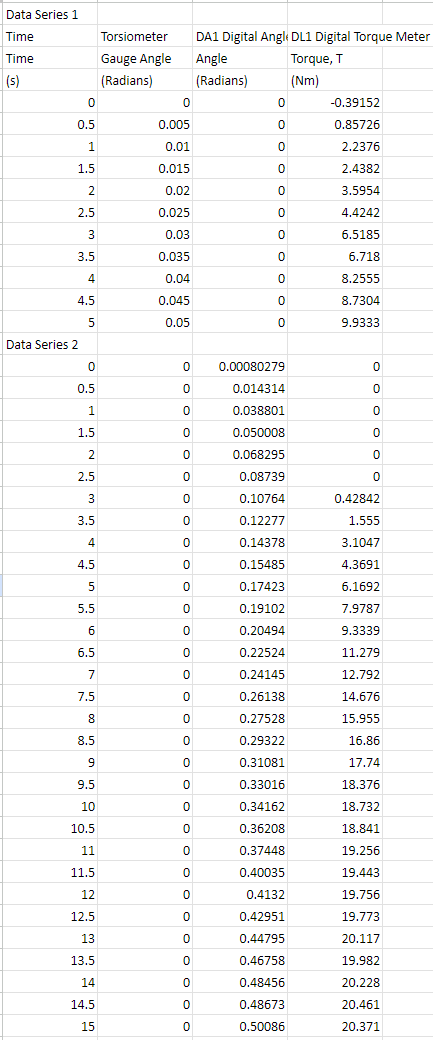
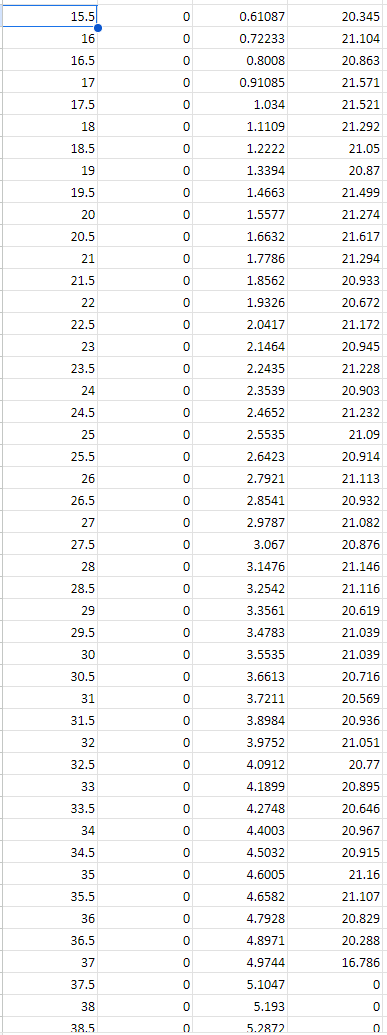

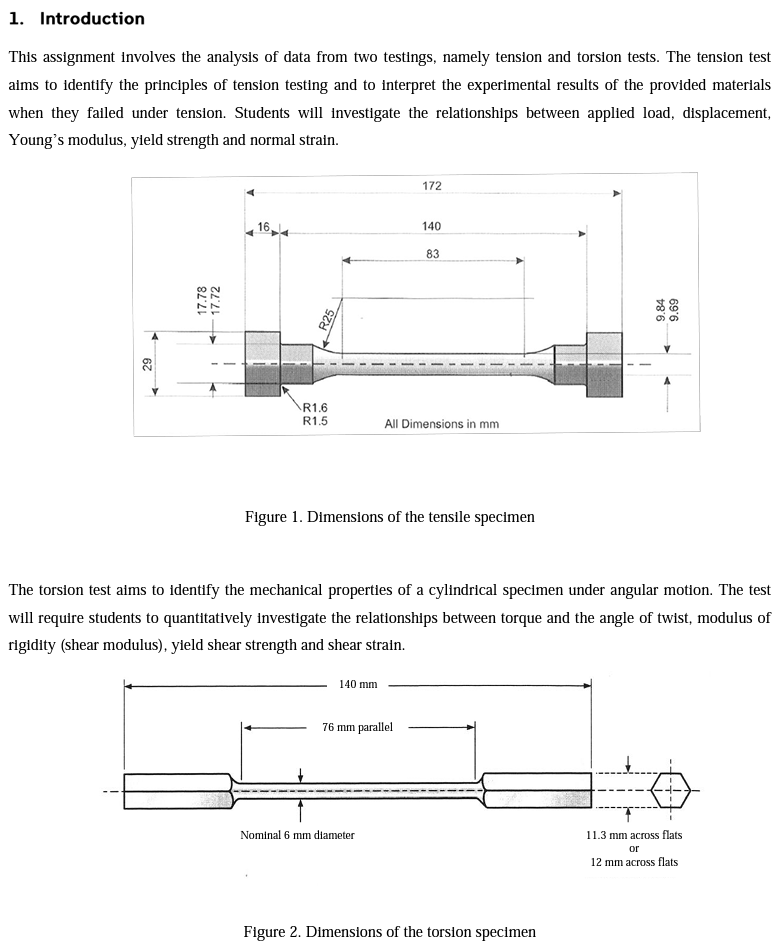
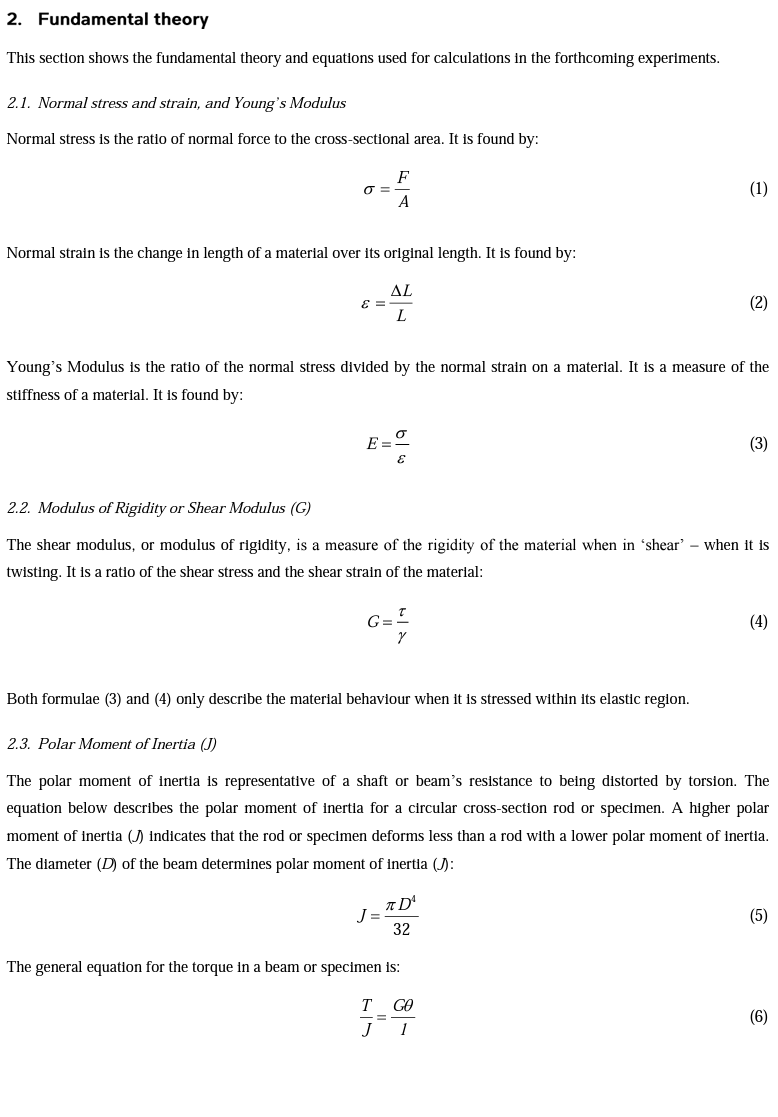
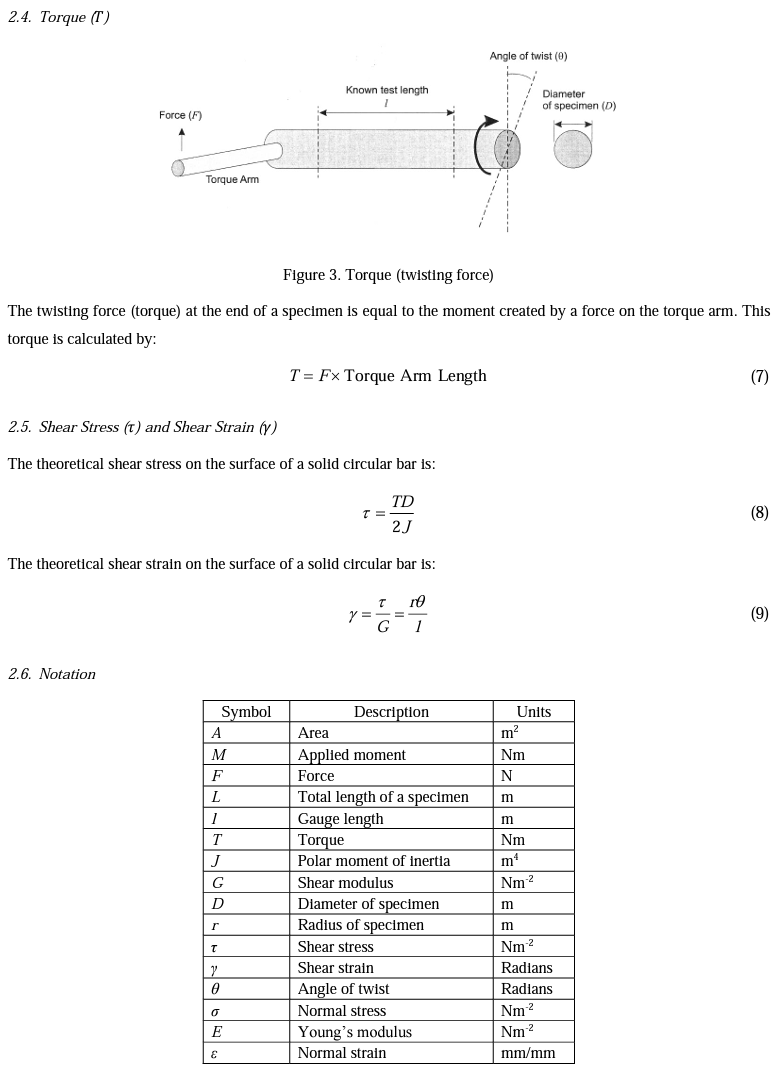
5. Part 2: Torsion testing The aim of the torsion test is to find the shear modulus, yield and ultimate shear strength for the specimen material. Use the supplied dataset that matches with the LAST number in the 8 number string found beneath the QR code in your registered PSS booklet. The dataset is of a torsion test with a 1214 mild steel test specimen (dimensions can be found in Figure 2). Do the following tasks: 5.1. Analysis of results i. Plot graph(s) of the raw supplied data obtained from the torsion testing experiment. You should present the torque vs. angular displacement relationship for both the torsiometer (measured across a gauge length of 50 mm) and the digital angle readout (measured across the loaded length of the specimen). ii. Convert the raw supplied data to shear stress 7 and shear strain y. You may need to adjust the data points to account for improper zeroing or other errors. The procedure should be clearly described and a fully worked example calculation should be given. iii. Plot a graph of shear stress 7 (vertical axis) against shear strain y (horizontal axis) using the torsiometer dataset. iv. Calculate the shear modulus G of the material using the torsiometer data set. The procedure should be clearly described. V. Plot a graph of shear stress 7 (vertical axis) against shear strain y (horizontal axis) using the digital angle readout dataset. vi. On your digital angle readout plot, mark the yield and ultimate points. Also, present the values in writing. vii. Compare the shear yield stresses predicted by the tensile test with the values observed during the torsion test. Discuss the suitability of the failure criterion for failure prediction. Data Series 1 Time Time (5) Data Series 2 Torsiometer DA1 Digital Angle DL1 Digital Torque Meter Gauge Angle Angle Torque, T (Radians) (Radians) (Nm) 0 0 0 -0.39152 0.5 0.005 0 0.85726 1 0.01 0 2.2376 1.5 0.015 0 2.4382 2 0.02 0 3.5954 2.5 0.025 0 4.4242 3 0.03 0 6.5185 3.5 0.035 0 6.718 4 0.04 0 8.2555 4.5 0.045 0 8.7304 5 0.05 0 9.9333 0 0 0.00080279 0 0.5 0 0.014314 0 1 0 0.038801 0 1.5 0 0.050008 0 2 0 0.068295 0 2.5 0 0.08739 0 3 0 0.10764 0.42842 3.5 0 0.12277 1.555 4 0 0.14378 3.1047 4.5 0 0.15485 4.3691 5 0 0.17423 6.1692 5.5 0 0.19102 7.9787 6 0 0.20494 9.3339 6.5 0 0.22524 11.279 7 0 0.24145 12.792 7.5 0 0.26138 14.676 8 0 0.27528 15.955 8.5 0 0.29322 16.86 9 0 0.31081 17.74 9.5 0 0.33016 18.376 10 0 0.34162 18.732 10.5 0 0.36208 18.841 11 0 0.37448 19.256 11.5 0 0.40035 19.443 12 0 0.4132 19.756 12.5 0 0.42951 19.773 13 0 0.44795 20.117 13.5 0 0.46758 19.982 14 0 0.48456 20.228 14.5 0 0.48673 20.461 15 0 0.50086 20.371 15.5 0 0.61087 20.345 16 0 0.72233 21.104 16.5 0 0.8008 20.863 17 0 0.91085 21.571 17.5 0 1.034 21.521 18 0 1.1109 21.292 18.5 0 1.2222 21.05 19 0 1.3394 20.87 19.5 0 1.4663 21.499 20 0 1.5577 21.274 20.5 0 1.6632 21.617 21 0 1.7786 21.294 21.5 0 1.8562 20.933 22 0 1.9326 20.672 22.5 0 2.0417 21.172 23 0 2.1464 20.945 23.5 0 2.2435 21.228 24 0 2.3539 20.903 24.5 0 2.4652 21.232 25 0 2.5535 21.09 25.5 0 2.6423 20.914 26 0 2.7921 21.113 26.5 0 2.8541 20.932 27 0 2.9787 21.082 27.5 0 3.067 20.876 28 0 3.1476 21.146 28.5 0 3.2542 21.116 29 0 3.3561 20.619 29.5 0 3.4783 21.039 30 0 3.5535 21.039 30.5 0 3.6613 20.716 31 0 3.7211 20.569 31.5 0 3.8984 20.936 32 0 3.9752 21.051 32.5 0 4.0912 20.77 33 0 4.1899 20.895 33.5 0 4.2748 20.646 34 0 4.4003 20.967 34.5 0 4.5032 20.915 35 0 4.6005 21.16 35.5 0 4.6582 21.107 36 0 4.7928 20.829 36.5 0 4.8971 20.288 37 0 4.9744 16.786 37.5 0 5.1047 0 38 0 5.193 0 38.5 0 5.2872 0 38.5 0 5.2872 0 39 0 5.3861 0 39.5 0 5.5266 0 1. Introduction This assignment involves the analysis of data from two testings, namely tension and torsion tests. The tension test aims to identify the principles of tension testing and to interpret the experimental results of the provided materials when they failed under tension. Students will investigate the relationships between applied load, displacement, Young's modulus, yield strength and normal strain. 29 17.78 17.72 164 R1.6 R25 172 140 83 R1.5 All Dimensions in mm Figure 1. Dimensions of the tensile specimen 9.84 69'6 The torsion test aims to identify the mechanical properties of a cylindrical specimen under angular motion. The test will require students to quantitatively investigate the relationships between torque and the angle of twist, modulus of rigidity (shear modulus), yield shear strength and shear strain. 140 mm 76 mm parallel Nominal 6 mm diameter Figure 2. Dimensions of the torsion specimen 11.3 mm across flats or 12 mm across flats 2. Fundamental theory This section shows the fundamental theory and equations used for calculations in the forthcoming experiments. 2.1. Normal stress and strain, and Young's Modulus Normal stress is the ratio of normal force to the cross-sectional area. It is found by: F A Normal strain is the change in length of a material over its original length. It is found by: = L (1) (2) Young's Modulus is the ratio of the normal stress divided by the normal strain on a material. It is a measure of the stiffness of a material. It is found by: E= (3) 2.2. Modulus of Rigidity or Shear Modulus (G) The shear modulus, or modulus of rigidity, is a measure of the rigidity of the material when in 'shear' - when it is twisting. It is a ratio of the shear stress and the shear strain of the material: G= I (4) Both formulae (3) and (4) only describe the material behaviour when it is stressed within its elastic region. 2.3. Polar Moment of Inertia (J) The polar moment of inertia is representative of a shaft or beam's resistance to being distorted by torsion. The equation below describes the polar moment of inertia for a circular cross-section rod or specimen. A higher polar moment of inertia () indicates that the rod or specimen deforms less than a rod with a lower polar moment of inertia. The diameter (D) of the beam determines polar moment of inertia (J): J D' 32 The general equation for the torque in a beam or specimen is: T GO J = 1 (5) (6) 2.4. Torque (T) Force (F) Torque Arm Known test length 1 Angle of twist (0) Diameter of specimen (D) Figure 3. Torque (twisting force) The twisting force (torque) at the end of a specimen is equal to the moment created by a force on the torque arm. This torque is calculated by: 2.5. Shear Stress (t) and Shear Strain (y) T=Fx Torque Arm Length The theoretical shear stress on the surface of a solid circular bar is: TD T= 2J The theoretical shear strain on the surface of a solid circular bar is: r0 1 y = G = 2.6. Notation Symbol Description Units A Area m M Applied moment Nm F Force N L Total length of a specimen m 1 EIS[SS[ Gauge length m T Torque Nm J Polar moment of inertia m G Shear modulus Nm D Diameter of specimen m Radius of specimen m Shear stress Nm Shear strain Radians 0 Angle of twist Radians Normal stress Nm Young's modulus Nm E Normal strain mm/mm (7) (8) (9)
Step by Step Solution
There are 3 Steps involved in it
Step: 1

Get Instant Access to Expert-Tailored Solutions
See step-by-step solutions with expert insights and AI powered tools for academic success
Step: 2

Step: 3
Ace Your Homework with AI
Get the answers you need in no time with our AI-driven, step-by-step assistance
Get Started
Essentials Of Statistics For The Behavioral Sciences
Authors: Susan A. Nolan
3rd Edition
1464107777, 978-1464107771