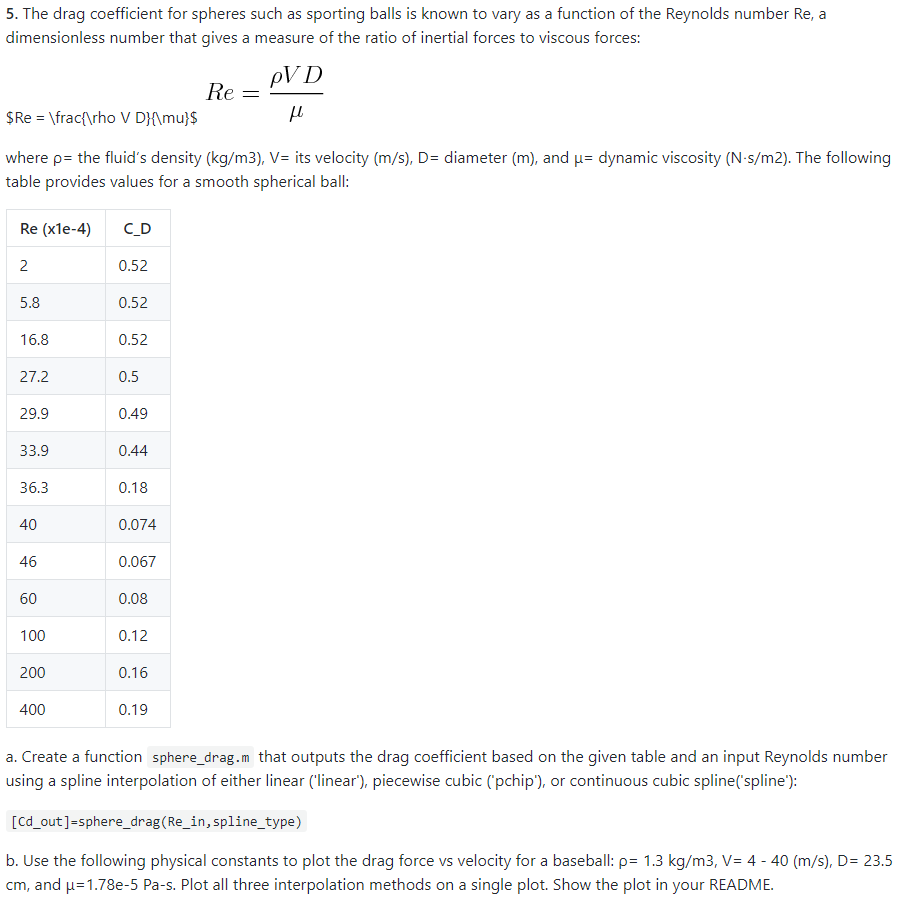
5. The drag coefficient for spheres such as sporting balls is known to vary as a function of the Reynolds number Re, a dimensionless number that gives a measure of the ratio of inertial forces to viscous forces: $ Re = \frac{ ho V DH\mu)$ where = the fluid's density (kg/m3), V= its velocity (m/s), D-diameter (m), and = dynamic viscosity (Ns/m2). The following table provides values for a smooth spherical ball Re (xle-4) CD 5.8 16.8 27.2 29.9 33.9 36.3 40 46 60 100 200 400 0.52 0.52 0.52 0.5 0.49 0.44 0.18 0.074 0.067 0.08 0.12 0.16 0.19 a. Create a function sphere-drag. m that outputs the drag coefficient based on the given table and an input Reynolds number using a spline interpolation of either linear (linear), piecewise cubic (pchip'), or continuous cubic spline(spline) [Cd_out]-sphere drag (Re_in, spline_type) b. Use the following physical constants to plot the drag force vs velocity for a baseball: = 1.3 kg/m3, V= 4-40 (m/s), D= 23.5 cm, and =1.78e-5 Pa-s. Plot all three interpolation methods on a single plot. Show the plot in your README. 5. The drag coefficient for spheres such as sporting balls is known to vary as a function of the Reynolds number Re, a dimensionless number that gives a measure of the ratio of inertial forces to viscous forces: $ Re = \frac{ ho V DH\mu)$ where = the fluid's density (kg/m3), V= its velocity (m/s), D-diameter (m), and = dynamic viscosity (Ns/m2). The following table provides values for a smooth spherical ball Re (xle-4) CD 5.8 16.8 27.2 29.9 33.9 36.3 40 46 60 100 200 400 0.52 0.52 0.52 0.5 0.49 0.44 0.18 0.074 0.067 0.08 0.12 0.16 0.19 a. Create a function sphere-drag. m that outputs the drag coefficient based on the given table and an input Reynolds number using a spline interpolation of either linear (linear), piecewise cubic (pchip'), or continuous cubic spline(spline) [Cd_out]-sphere drag (Re_in, spline_type) b. Use the following physical constants to plot the drag force vs velocity for a baseball: = 1.3 kg/m3, V= 4-40 (m/s), D= 23.5 cm, and =1.78e-5 Pa-s. Plot all three interpolation methods on a single plot. Show the plot in your README


