Answered step by step
Verified Expert Solution
Question
1 Approved Answer
5. The following table list the midterm scores (x) and final exam scores (y) for a random sample of 10 students in Stat 141 X
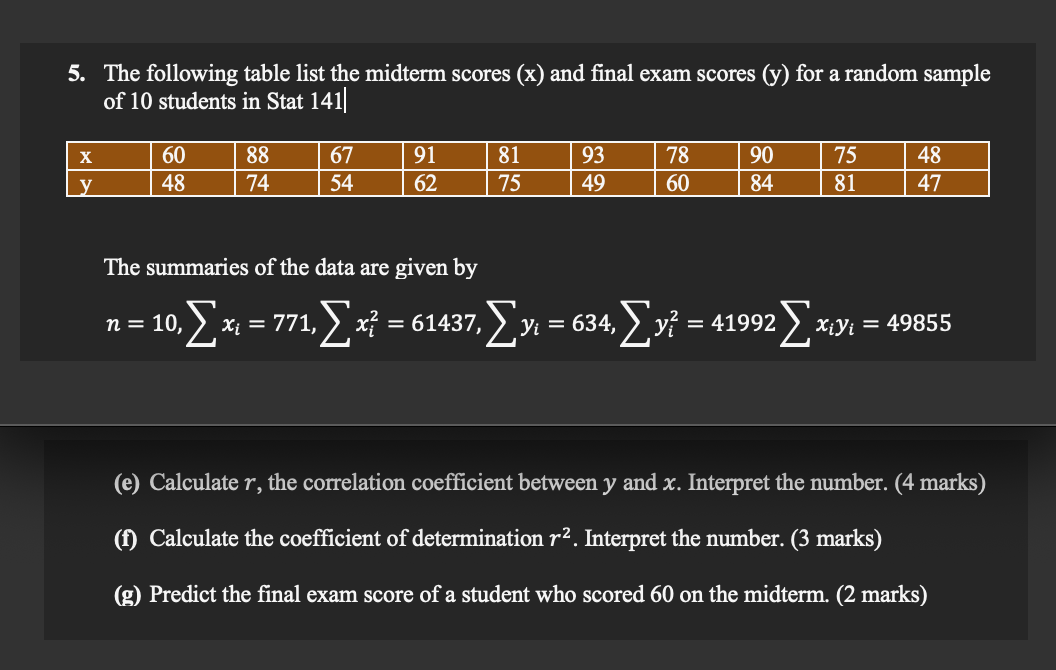
5. The following table list the midterm scores (x) and final exam scores (y) for a random sample of 10 students in Stat 141 X 60 88 67 91 81 93 78 90 75 48 V 48 74 54 62 75 49 60 84 81 47 The summaries of the data are given by n = 10, > x: = 771, > x7 = 61437, Zy = 634, Y y? = 41992 Xiyi = 49855 (e) Calculate r, the correlation coefficient between y and x. Interpret the number. (4 marks) (f) Calculate the coefficient of determination r2. Interpret the number. (3 marks) (g) Predict the final exam score of a student who scored 60 on the midterm. (2 marks)
Step by Step Solution
There are 3 Steps involved in it
Step: 1
Get Instant Access to Expert-Tailored Solutions
See step-by-step solutions with expert insights and AI powered tools for academic success
Step: 2
Step: 3
Ace Your Homework with AI
Get the answers you need in no time with our AI-driven, step-by-step assistance
Get Started