Answered step by step
Verified Expert Solution
Link Copied!

Question

1 Approved Answer

. 5) The waiting times between a subway departure schedule and the arrival of a passenger are uniformly distributed between 0 and 9 minutes. Find
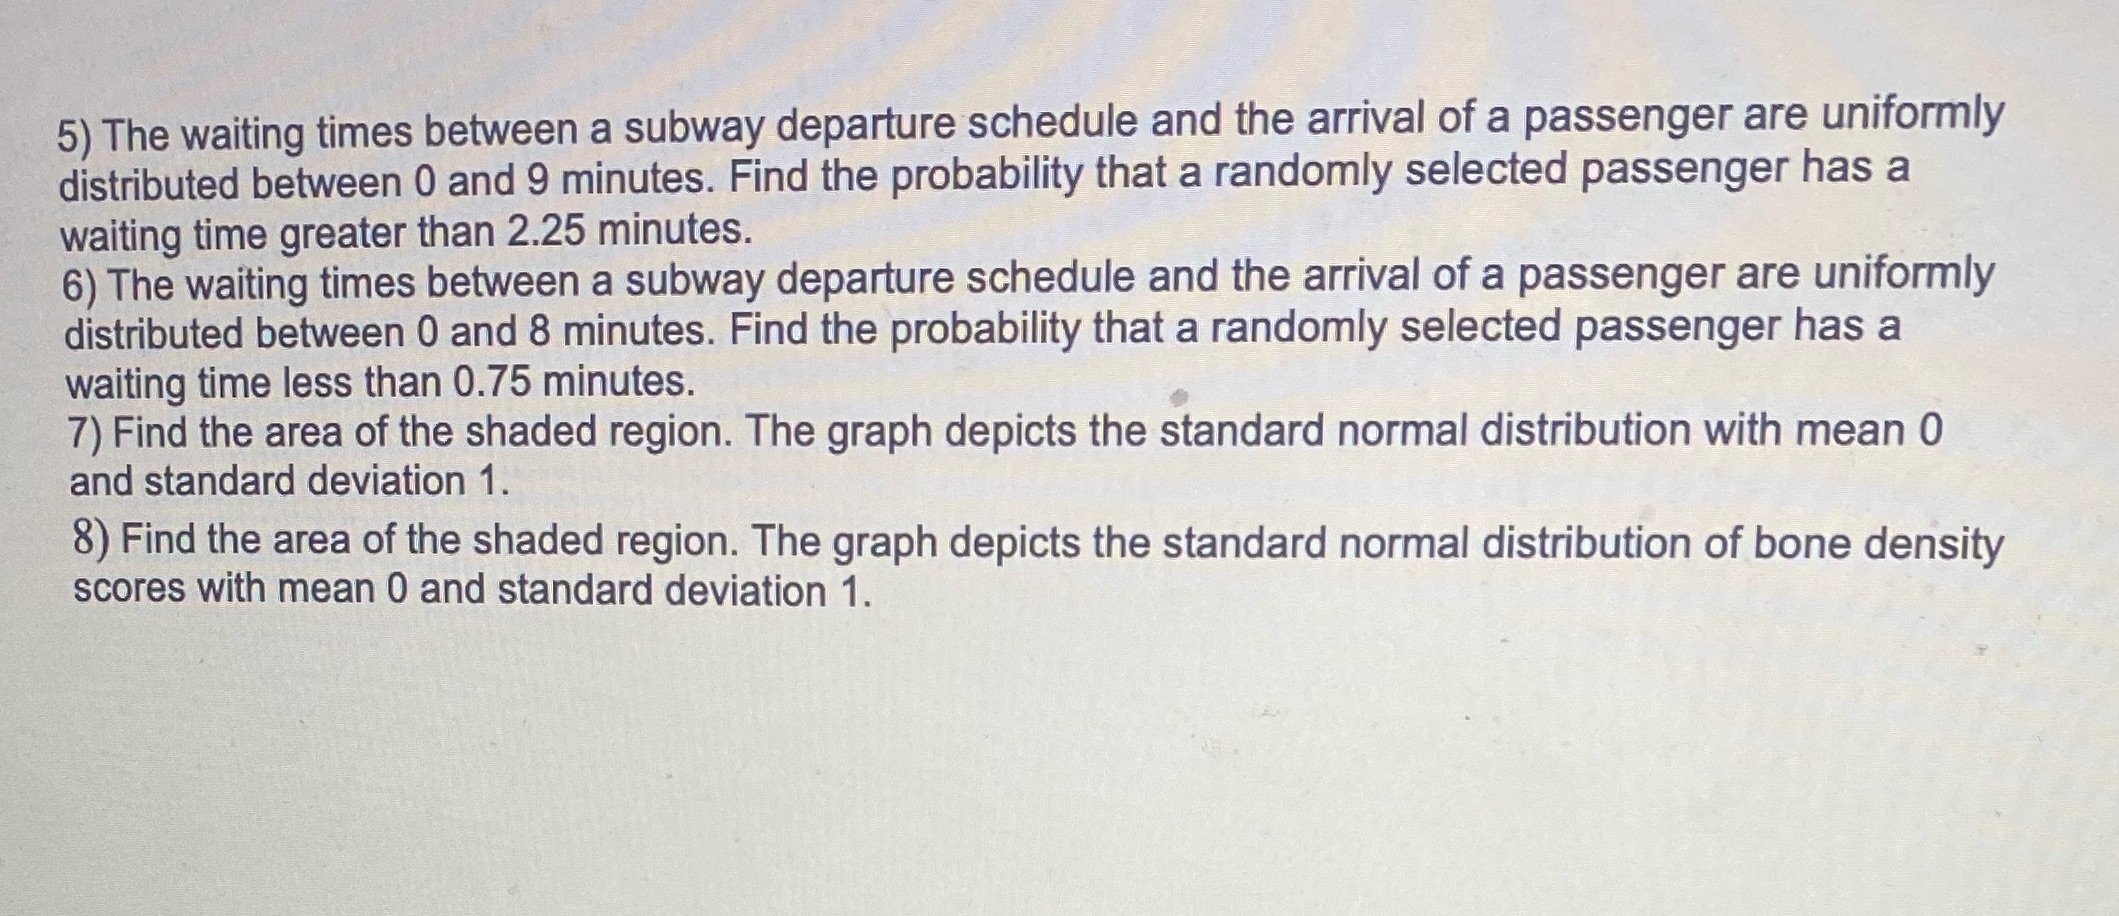
image text in transcribed
. 5) The waiting times between a subway departure schedule and the arrival of a passenger are uniformly distributed between 0 and 9 minutes. Find the probability that a randomly selected passenger has a waiting time greater than 2.25 minutes. _ ' 6) The waiting times between a subway departure schedule and the arrival of a passenger are uniformly distributed between 0 and 8 minutes. Find the probability that a randomly selected passenger has a waiting time less than 0.75 minutes. , 7) Find the area of the shaded region. The graph depicts the standard normal distribution with mean 0 and standard deviation 1. 8) Find the area of the shaded region. The graph depicts the standard normal distribution of bone density scores with mean '0 and standard deviation 1

Step by Step Solution

There are 3 Steps involved in it

Step: 1

blur-text-image

Get Instant Access to Expert-Tailored Solutions

See step-by-step solutions with expert insights and AI powered tools for academic success

Step: 2

blur-text-image_2

Step: 3

blur-text-image_3

Ace Your Homework with AI

Get the answers you need in no time with our AI-driven, step-by-step assistance

Get Started

Recommended Textbook for

Quantitative Analysis For Management

Authors: Barry Render, Ralph M. Stair, Michael E. Hanna

11th Edition

9780132997621, 132149117, 132997622, 978-0132149112

Students also viewed these Mathematics questions