(50 pts) The StreamStats report for a tributary watershed of the Catalpa Creek is presented below. A development project would convert the watershed to an entirely urban system. The forest land of the watershed would be converted into a Highly Developed area. Using a precipitation design of 5.92in and a duration of 24 hours, complete an entire hydrological analysis to determine:
2. The additional runoff depth and volume that would be observed in the watershed due to the urban development
3. The size of a squared detention pond that could be implemented to store all the runoff excess if the maximum depth of the system is 10 ft
4. The differences in peak flow between pre and post development senarios
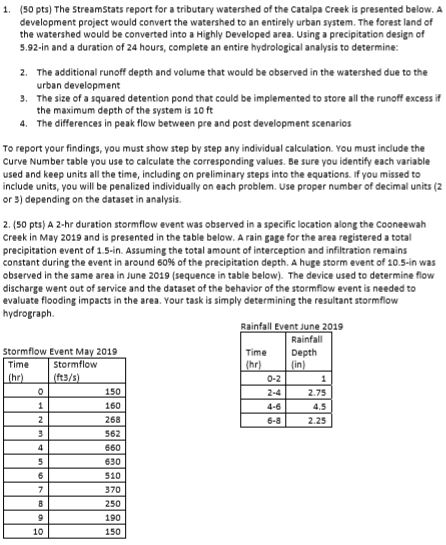
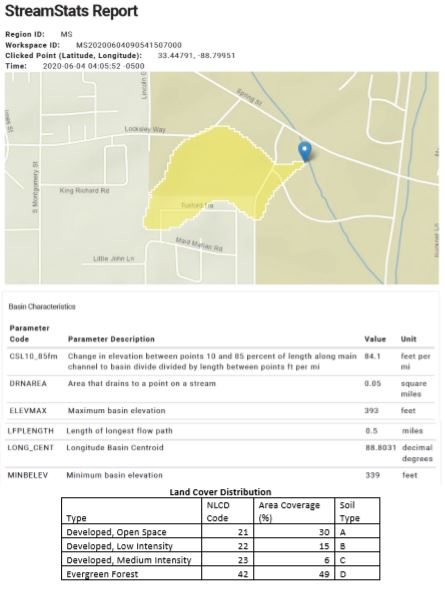
1. (50 pts) The StreamStats report for a tributary watershed of the Catalpa Creek is presented below. A development project would convert the watershed to an entirely urban system. The forest land of the watershed would be converted into a Highly Developed area. Using a precipitation design of 5.92-in and a duration of 24 hours, complete an entire hydrological analysis to determine: 2. The additional runoff depth and volume that would be observed in the watershed due to the urban development 3. The size of a squared detention pond that could be implemented to store all the runoff excess it the maximum depth of the system is 10 ft 4. The differences in peak flow between pre and post development scenarios To report your findings, you must show step by step any individual calculation. You must include the curve Number table you use to calculate the corresponding values. Be sure you identify each variable used and keep units all the time, including on preliminary steps into the equations. If you missed to include units, you will be penalized individually on each problem. Use proper number of decimal units (2 or 3) depending on the dataset in analysis. 2. (50 pts) A 2-hr duration stormflow event was observed in a specific location along the Cooneewah Creek in May 2019 and is presented in the table below. A rain gage for the area registered a total precipitation event of 1.5-in. Assuming the total amount of interception and infiltration remains constant during the event in around 50% of the precipitation depth. A huge storm event of 10.5-in was observed in the same area in June 2019 (sequence in table below). The device used to determine flow discharge went out of service and the dataset of the behavior of the stormflow event is needed to evaluate flooding impacts in the area. Your task is simply determining the resultant stormflow hydrograph Rainfall Event June 2019 Rainfall Stormflow Event May 2019 Depth (hr) (in) (hr) (ft3/s) 0-2 Time Time Stormflow 150 0 1 1 2.75 4.5 2.25 160 4-6 6-8 2 268 562 3 4 660 7 630 510 370 250 190 150 8 9 10 StreamStats Report Region ID: MS Workspace ID: MS20200604090541507000 Clicked Point (Latitude, Longitude): 33.44791.-13.19951 Time: 2020-06-04 04:05:52 0500 Most King hard LL Batin Characterfice Unit Parameter Code Parameter Description Value C110_05m Change in elevation between points 10 and as percent of length along main 14.1 channel to basin divide divided by length between points per mi URNAREA Area that drains to a point on a stream Teater mi square ELEVMAX Maximum basin elevation 39 feet LFPLENGTH Length of longest flow path LONG_CENT Longitude Basin Centroid 8.8031 decimal degrees MINBELEV Minimum basin elevation 399 Teet Land Cover Distribution NLCD Area Coverage Soil Type Code (96) Type Developed, Open Space 21 30 A Developed, Low Intensity 22 15 B Developed Medium intensity 23 6C Evergreen Forest 42 49 D 1. (50 pts) The StreamStats report for a tributary watershed of the Catalpa Creek is presented below. A development project would convert the watershed to an entirely urban system. The forest land of the watershed would be converted into a Highly Developed area. Using a precipitation design of 5.92-in and a duration of 24 hours, complete an entire hydrological analysis to determine: 2. The additional runoff depth and volume that would be observed in the watershed due to the urban development 3. The size of a squared detention pond that could be implemented to store all the runoff excess it the maximum depth of the system is 10 ft 4. The differences in peak flow between pre and post development scenarios To report your findings, you must show step by step any individual calculation. You must include the curve Number table you use to calculate the corresponding values. Be sure you identify each variable used and keep units all the time, including on preliminary steps into the equations. If you missed to include units, you will be penalized individually on each problem. Use proper number of decimal units (2 or 3) depending on the dataset in analysis. 2. (50 pts) A 2-hr duration stormflow event was observed in a specific location along the Cooneewah Creek in May 2019 and is presented in the table below. A rain gage for the area registered a total precipitation event of 1.5-in. Assuming the total amount of interception and infiltration remains constant during the event in around 50% of the precipitation depth. A huge storm event of 10.5-in was observed in the same area in June 2019 (sequence in table below). The device used to determine flow discharge went out of service and the dataset of the behavior of the stormflow event is needed to evaluate flooding impacts in the area. Your task is simply determining the resultant stormflow hydrograph Rainfall Event June 2019 Rainfall Stormflow Event May 2019 Depth (hr) (in) (hr) (ft3/s) 0-2 Time Time Stormflow 150 0 1 1 2.75 4.5 2.25 160 4-6 6-8 2 268 562 3 4 660 7 630 510 370 250 190 150 8 9 10 StreamStats Report Region ID: MS Workspace ID: MS20200604090541507000 Clicked Point (Latitude, Longitude): 33.44791.-13.19951 Time: 2020-06-04 04:05:52 0500 Most King hard LL Batin Characterfice Unit Parameter Code Parameter Description Value C110_05m Change in elevation between points 10 and as percent of length along main 14.1 channel to basin divide divided by length between points per mi URNAREA Area that drains to a point on a stream Teater mi square ELEVMAX Maximum basin elevation 39 feet LFPLENGTH Length of longest flow path LONG_CENT Longitude Basin Centroid 8.8031 decimal degrees MINBELEV Minimum basin elevation 399 Teet Land Cover Distribution NLCD Area Coverage Soil Type Code (96) Type Developed, Open Space 21 30 A Developed, Low Intensity 22 15 B Developed Medium intensity 23 6C Evergreen Forest 42 49 D