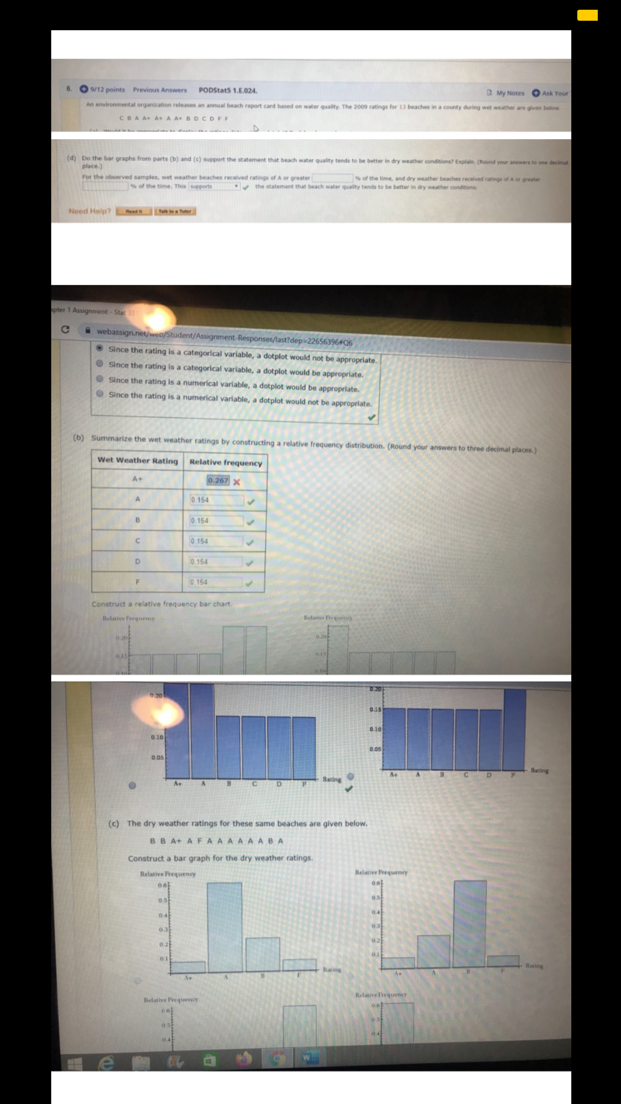
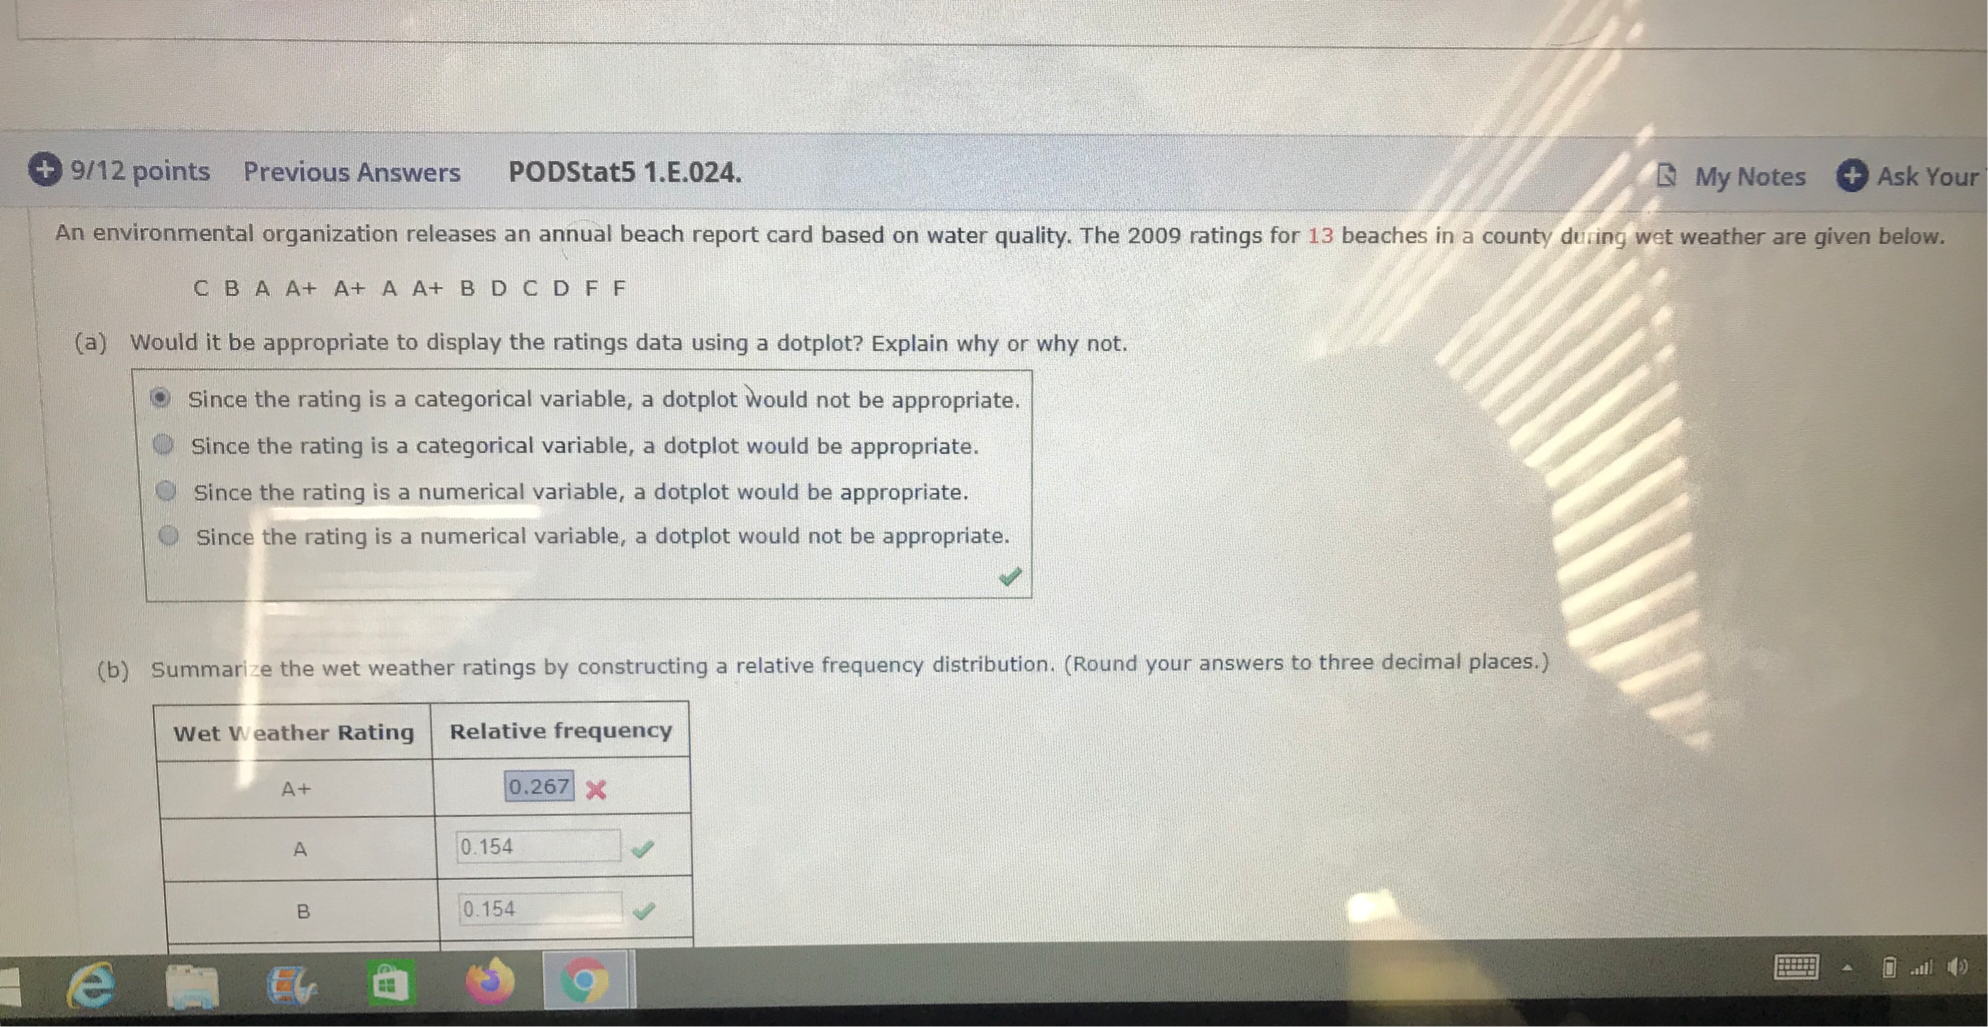
6. 12 points Previous Answers PODStats 1.E.024. My Notes O Ask Your wal beach report card buned on water quality. The 2009 mati (d) Do the bar graphs from parts (b] and (c] support the stateme plate.) For the observed samples, wet weather bea thes received ratings of A or greater of the time, and dry weather beaches received ning " of the time, This upports Need Help? howshows pter 1 Assignment - Star 33 C webassign.net Student/Assignment-Responses/last dep-22656396806 Since the rating is a categorical variable, a dotplot would not be appropriate. Since the rating is a categorical variable, a dotplot would be appropriate. Since the rating is a numerical variable, a dotplot would be appropriate. O Since the rating is a numerical variable, a dotplot would not be appropriate. [b) Summarize the wet weather ratings by constructing a relative frequency distribution. [Round your answers to three decimal places.) Wet Weather Rating Relative frequency A+ 0.267 % 0.154 B 0. 154 C 0.154 D 0.154 0 154 Construct a relative frequency bar chart. (c) The dry weather ratings for these same beaches are given below. BBA AFAAAAAADA Construct a bar graph for the dry weather ratings L L Relatives Frequency Belair Firquen+ 9/12 points Previous Answers PODStat5 1.E.024. My Notes + Ask Your An environmental organization releases an annual beach report card based on water quality. The 2009 ratings for 13 beaches in a county during wet weather are given below. C B AA+ A+ A A+ B D C D F F (a) Would it be appropriate to display the ratings data using a dotplot? Explain why or why not. Since the rating is a categorical variable, a dotplot would not be appropriate. Since the rating is a categorical variable, a dotplot would be appropriate. Since the rating is a numerical variable, a dotplot would be appropriate. Since the rating is a numerical variable, a dotplot would not be appropriate. (b) Summarize the wet weather ratings by constructing a relative frequency distribution. (Round your answers to three decimal places.) Wet Weather Rating Relative frequency A+ 0.267 X A 0. 154 B 0. 154 e


