Answered step by step
Verified Expert Solution
Link Copied!

Question

1 Approved Answer

6. A college professor surveys 50 college freshmen to determine how many different homes they lived in from birth to age 18. The results of
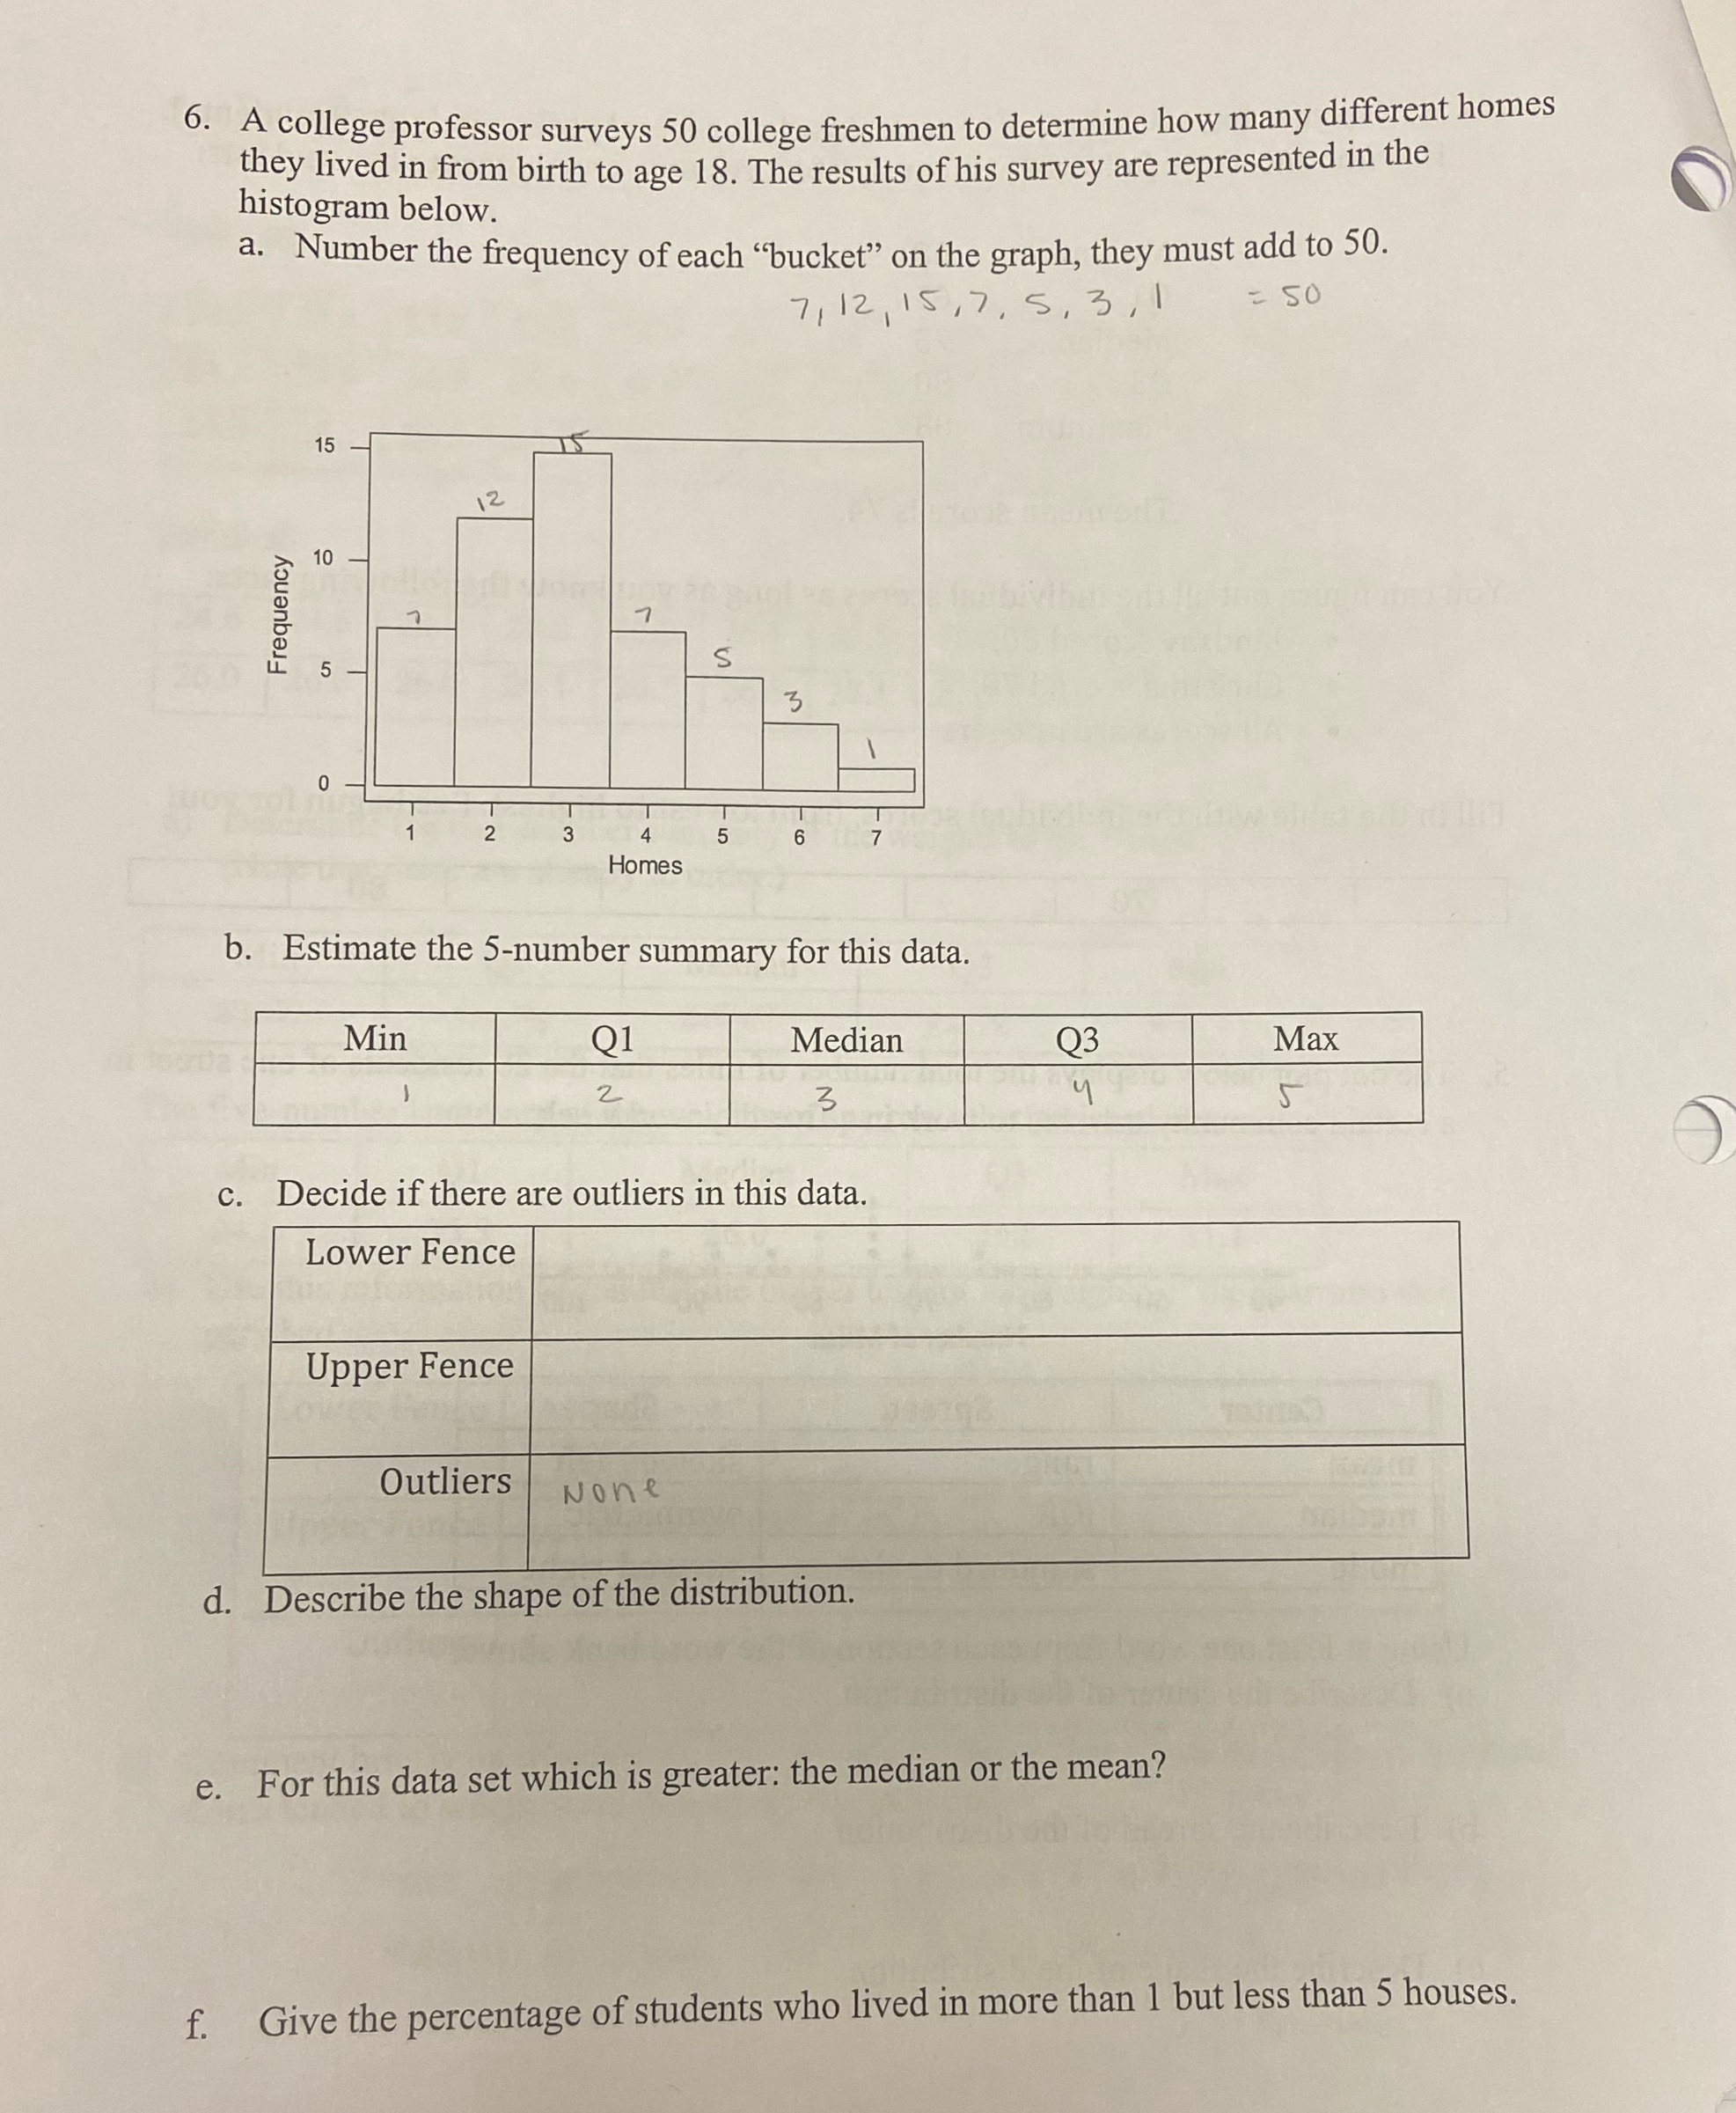
image text in transcribed
6. A college professor surveys 50 college freshmen to determine how many different homes they lived in from birth to age 18. The results of his survey are represented in the histogram below. a. Number the frequency of each "bucket" on the graph, they must add to 50. 7, 12 , 15 , 7 . 5 , 3 , 1 = 50 15 10 Frequency 5 3 6 Homes b. Estimate the 5-number summary for this data. Min Q1 Median Q3 Max 2 3 5 c. Decide if there are outliers in this data. Lower Fence Upper Fence Outliers None d. Describe the shape of the distribution. e. For this data set which is greater: the median or the mean? f. Give the percentage of students who lived in more than 1 but less than 5 houses

Step by Step Solution

There are 3 Steps involved in it

Step: 1

blur-text-image

Get Instant Access to Expert-Tailored Solutions

See step-by-step solutions with expert insights and AI powered tools for academic success

Step: 2

blur-text-image

Step: 3

blur-text-image

Ace Your Homework with AI

Get the answers you need in no time with our AI-driven, step-by-step assistance

Get Started

Recommended Textbook for

Numerical Analysis

Authors: Richard L. Burden, J. Douglas Faires

9th edition

538733519, 978-1133169338, 1133169333, 978-0538733519

More Books

Students also viewed these Mathematics questions