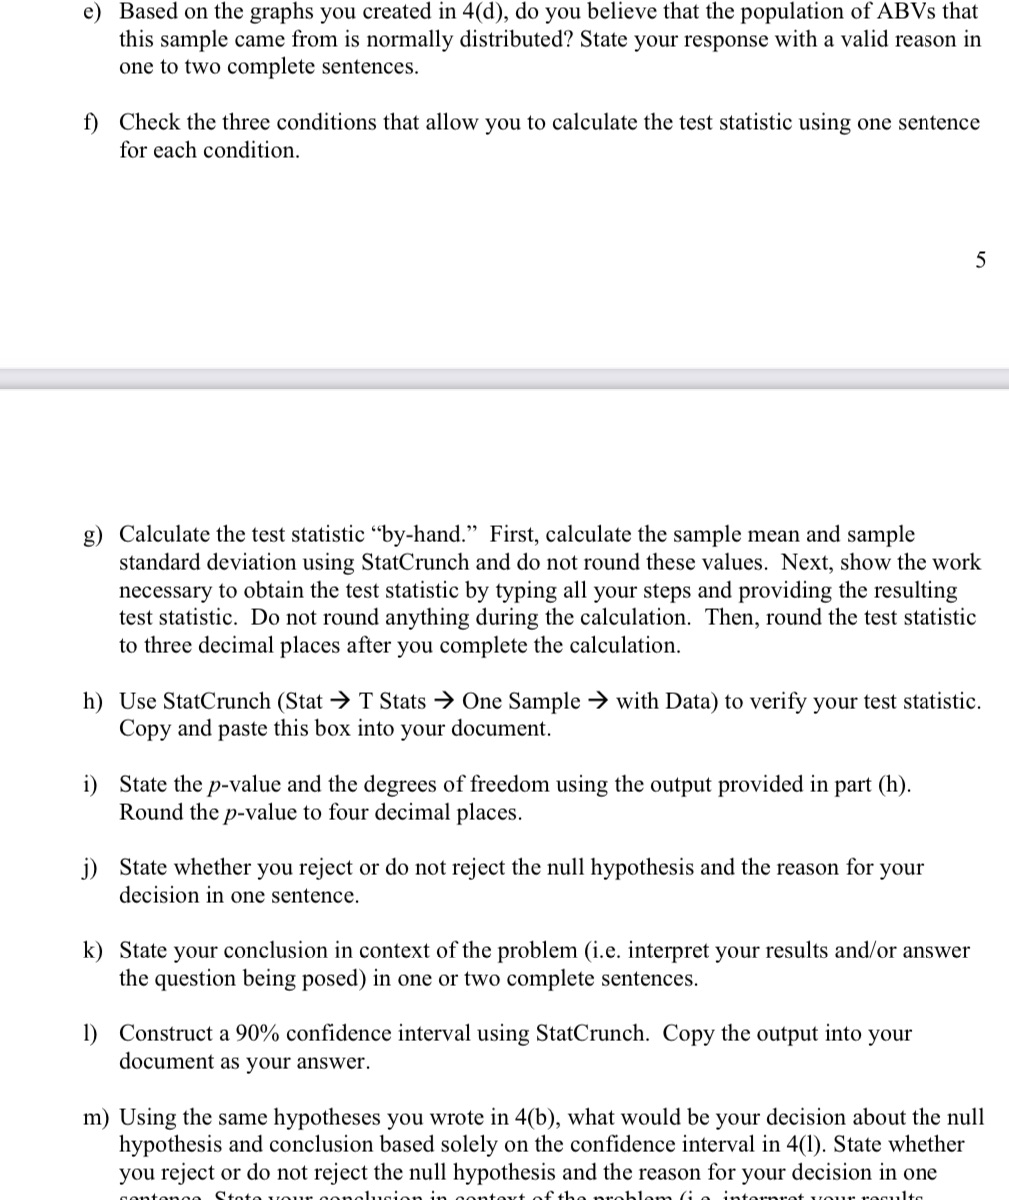
6) Based on the graphs you created in 4(d), do you believe that the population of ABVs that this sample came from is normally distributed? State your response with a valid reason in one to two complete sentences. Check the three conditions that allow you to calculate the test statistic using one sentence for each condition. s) h) j) k) 1) Calculate the test statistic \"by-hand.\" First, calculate the sample mean and sample standard deviation using StatCrunch and do not round these values. Next, show the work necessary to obtain the test statistic by typing all your steps and providing the resulting test statistic. Do not round anything during the calculation. Then, round the test statistic to three decimal places after you complete the calculation. Use StatCrunch (Stat 9 T Stats 9 One Sample 9 with Data) to verify your test statistic. Copy and paste this box into your document. State the p-value and the degrees of freedom using the output provided in part (h). Round the pvalue to four decimal places. State whether you reject or do not reject the null hypothesis and the reason for your decision in one sentence. State your conclusion in context of the problem (i.e. interpret your results and/or answer the question being posed) in one or two complete sentences. Construct a 90% confidence interval using StatCrunch. Copy the output into your document as your answer. m) Using the same hypotheses you wrote in 4(b), what would be your decision about the null hypothesis and conclusion based solely on the condence interval in 4(1). State whether you reject or do not reject the null hypothesis and the reason for your decision' 1n one \"Ma-nun\" (I'd-ah. "A..- Anna-II unalnn. :n nAn-I-nu'l .14" 4-1.... nun'nlnonn. r: n :..-.-..-.....-.+ "A... an\". .l+