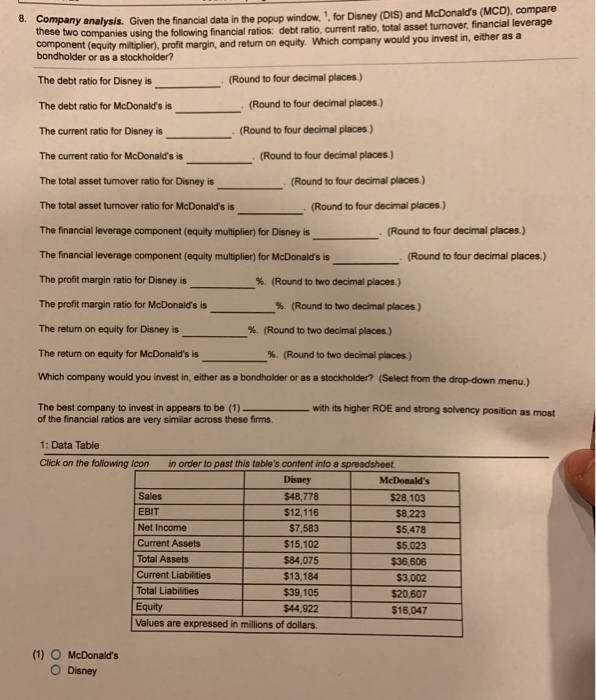
6. Company analysis. Given the financial data in the popup window. for Disney (DIS) and McDonald's (MCD), compare these two companies using the following financial ratios: debt ratio, current ratio, total asset turnover, financial leverage component (equity miltiplier), profit margin, and return on equity. Which company would you invest in, either as a bondholder or as a stockholder? The debt ratio for Disney is . (Round to four decimal places.) The debt ratio for McDonald's is (Round to four decimal places.) The current ratio for Disney is (Round to four decimal places.) The current ratio for McDonald's is (Round to four decimal places.) The total asset turnover ratio for Disney is (Round to four decimal places.) The total asset turnover ratio for McDonald's is (Round to four decimal places.) The financial leverage component (equity multiplier) for Disney is (Round to four decimal places.) The financial leverage component (equity multiplier) for McDonald's is (Round to four decimal places.) The profit margin ratio for Disney is %. (Round to two decimal places.) The profit margin ratio for McDonald's is %. (Round to two decimal places.) The return on equity for Disney is %. (Round to two decimal places.) The return on equity for McDonald's is %. (Round to two decimal places.) Which company would you invest in, either as a bondholder or as a stockholder? (Select from the drop-down menu.) The best company to invest in appears to be (1) - of the financial ratios are very similar across these firms. with its higher ROE and strong solvency position as most 1: Data Table Click on the following Icon in order to past this table's content into a spreadsheet Disney McDonald's Sales $48,778 $28,103 EBIT $12,116 $8,223 Net Income $7,583 $5,478 Current Assets $15,102 $5,023 Total Assets $84,075 $36,606 Current Liabilities $13,184 $3,002 Total Liabilities $39,105 $20,607 Equity $44, 922 16,047 Values are expressed in millions of dollars. (1) O McDonald's Disney