Answered step by step
Verified Expert Solution
Link Copied!

Question

1 Approved Answer

6. Consider figure 11-4 from O'Sullivan (Average Cost of Alternative Transportation Systems). In addition to the curves for BART and a bus system, draw a

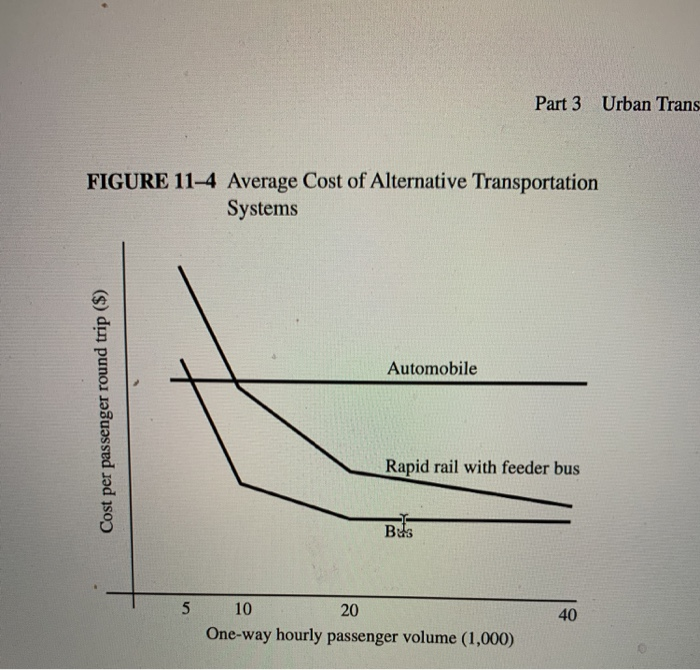
image text in transcribed
6. Consider figure 11-4 from O'Sullivan ("Average Cost of Alternative Transportation Systems"). In addition to the curves for BART and a bus system, draw a long-run average cost curve showing where light rail, such as MAX, would be. Explain your placement of the curve. Part 3 Urban Trans FIGURE 114 Average Cost of Alternative Transportation Systems Automobile Cost per passenger round trip ($) Rapid rail with feeder bus BUS 5 40 10 20 One-way hourly passenger volume (1,000) 6. Consider figure 11-4 from O'Sullivan ("Average Cost of Alternative Transportation Systems"). In addition to the curves for BART and a bus system, draw a long-run average cost curve showing where light rail, such as MAX, would be. Explain your placement of the curve. Part 3 Urban Trans FIGURE 114 Average Cost of Alternative Transportation Systems Automobile Cost per passenger round trip ($) Rapid rail with feeder bus BUS 5 40 10 20 One-way hourly passenger volume (1,000)

Step by Step Solution

There are 3 Steps involved in it

Step: 1

blur-text-image

Get Instant Access to Expert-Tailored Solutions

See step-by-step solutions with expert insights and AI powered tools for academic success

Step: 2

blur-text-image

Step: 3

blur-text-image

Ace Your Homework with AI

Get the answers you need in no time with our AI-driven, step-by-step assistance

Get Started

Students also viewed these Accounting questions