Answered step by step
Verified Expert Solution
Link Copied!

Question

1 Approved Answer

6. For each of the graphs below (5 points): 1. Find A(G) and y(G). ii. CLEARLY label or CLEARLY color each vertex to show a
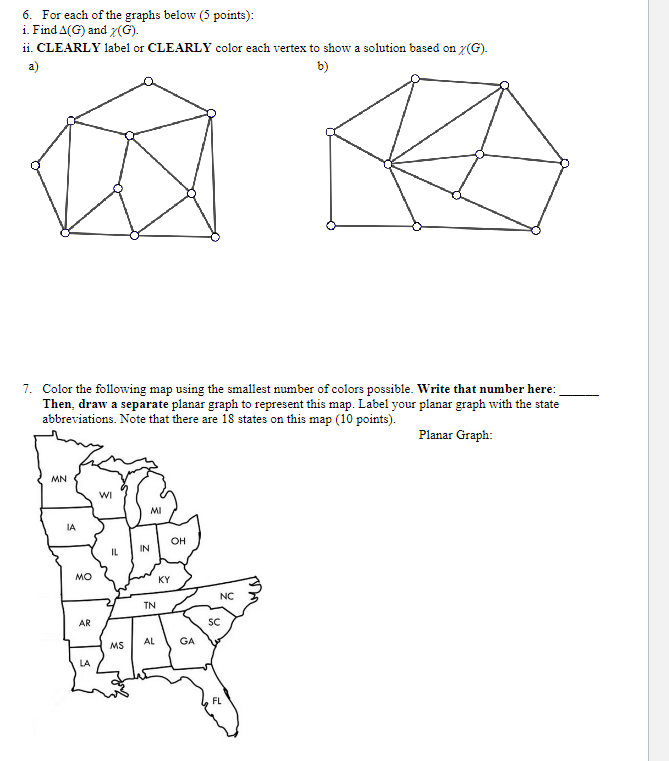
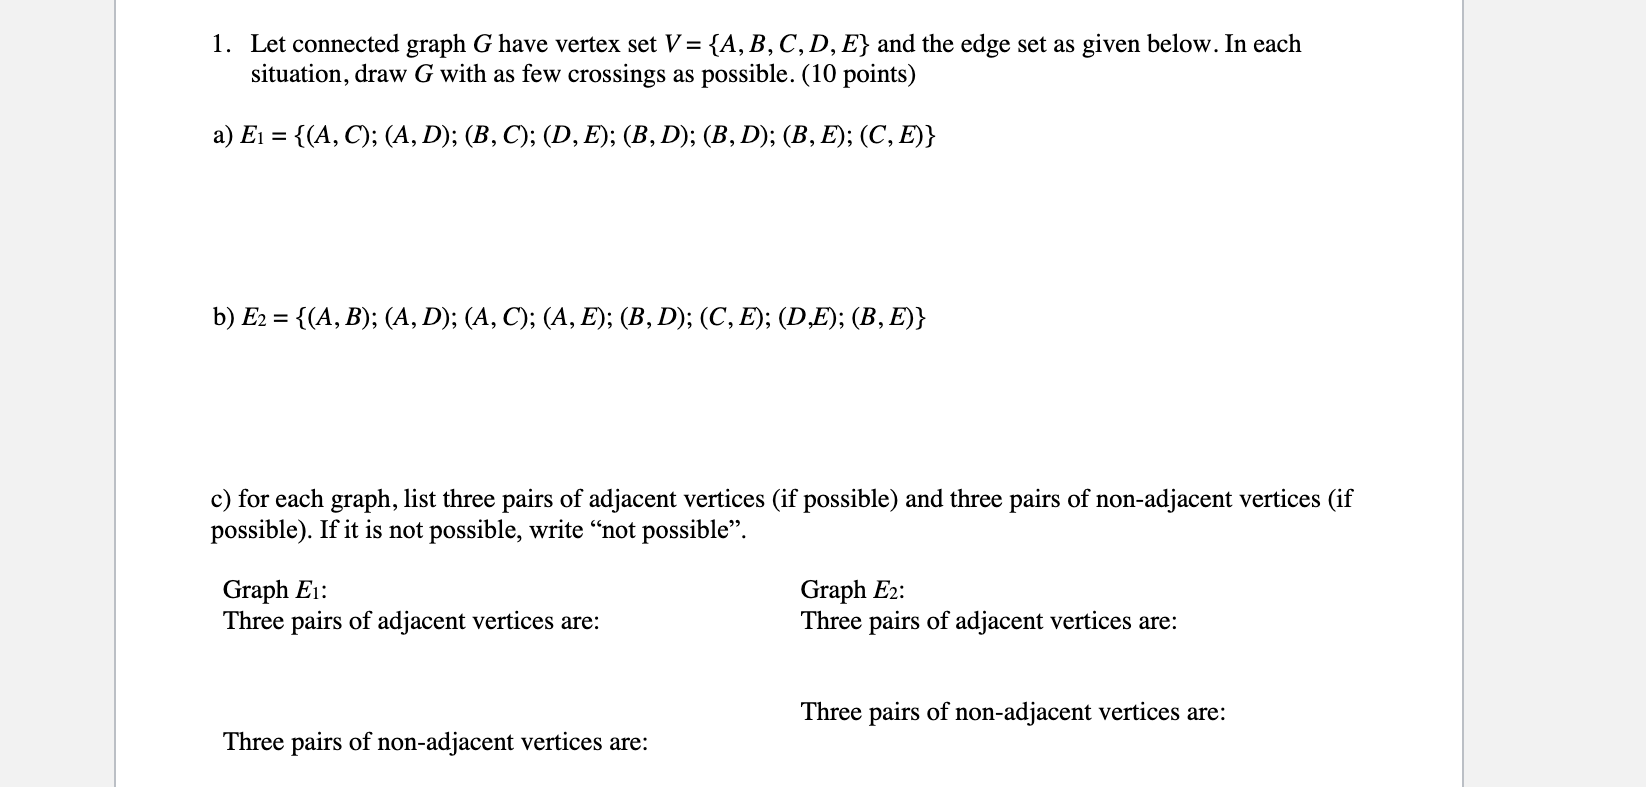
image text in transcribedimage text in transcribed
6. For each of the graphs below (5 points): 1. Find A(G) and y(G). ii. CLEARLY label or CLEARLY color each vertex to show a solution baszed on 3(G). 2) o) Color the following map using the smallest number of colors possible. Write that number here: Then, draw a separate planar graph to represent this map. Label vour planar graph with the state abbreviations. Note that there are 18 states on this map (10 points). T Planar Graph: 1. Let connected graph G have vertex set V = {A, B, C, D, E} and the edge set as given below. In each situation, draw G with as few crossings as possible. (10 points) a) E1={(A,C); (A, D); (B, O); (D, E); (B, D); (B, D); (B, E); (C,E)} b) E2 = {(A, B); (A, D); (A4, C); (A, E); (B, D); (C, E); (D.E); (B, E)} c) for each graph, list three pairs of adjacent vertices (if possible) and three pairs of non-adjacent vertices (if possible). If it is not possible, write \"not possible. Graph E1: Graph Ez: Three pairs of adjacent vertices are: Three pairs of adjacent vertices are: Three pairs of non-adjacent vertices are: Three pairs of non-adjacent vertices are

Step by Step Solution

There are 3 Steps involved in it

Step: 1

blur-text-image

Get Instant Access to Expert-Tailored Solutions

See step-by-step solutions with expert insights and AI powered tools for academic success

Step: 2

blur-text-image

Step: 3

blur-text-image

Ace Your Homework with AI

Get the answers you need in no time with our AI-driven, step-by-step assistance

Get Started

Recommended Textbook for

Quantitative Analysis For Management

Authors: Barry Render, Ralph M. Stair, Michael E. Hanna

11th Edition

9780132997621, 132149117, 132997622, 978-0132149112

Students also viewed these Mathematics questions