????????????????????????????
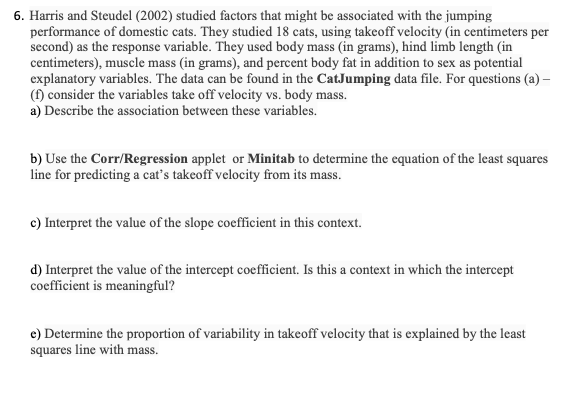
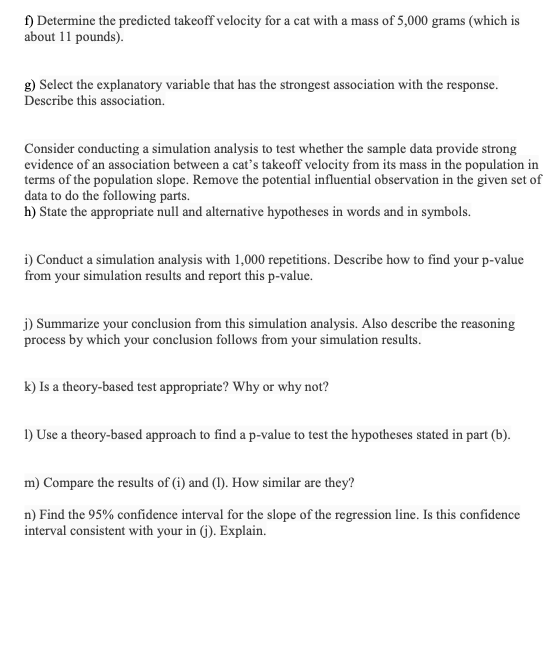
6. Harris and Steudel (2002) studied factors that might be associated with the jumping performance of domestic cats. They studied 18 cats, using takeoff velocity (in centimeters per second) as the response variable. They used body mass (in grams), hind limb length (in centimeters), muscle mass (in grams), and percent body fat in addition to sex as potential explanatory variables. The data can be found in the CatJumping data file. For questions (a) - (f) consider the variables take off velocity vs. body mass. a) Describe the association between these variables. b) Use the Corr/Regression applet or Minitab to determine the equation of the least squares line for predicting a cat's takeoff velocity from its mass. c) Interpret the value of the slope coefficient in this context. d) Interpret the value of the intercept coefficient. Is this a context in which the intercept coefficient is meaningful? e) Determine the proportion of variability in takeoff velocity that is explained by the least squares line with mass.() Determine the predicted takeoff velocity for a cat with a mass of 5,000 grams (which is about 11 pounds). g) Select the explanatory variable that has the strongest association with the response. Describe this association. Consider conducting a simulation analysis to test whether the sample data provide strong evidence of an association between a cat's takeoff velocity from its mass in the population in terms of the population slope. Remove the potential influential observation in the given set of data to do the following parts. h) State the appropriate null and alternative hypotheses in words and in symbols. i) Conduct a simulation analysis with 1,000 repetitions. Describe how to find your p-value from your simulation results and report this p-value. j) Summarize your conclusion from this simulation analysis. Also describe the reasoning process by which your conclusion follows from your simulation results. k) Is a theory-based test appropriate? Why or why not? 1) Use a theory-based approach to find a p-value to test the hypotheses stated in part (b). m) Compare the results of (i) and (1). How similar are they? n) Find the 95% confidence interval for the slope of the regression line. Is this confidence interval consistent with your in (j). Explain


